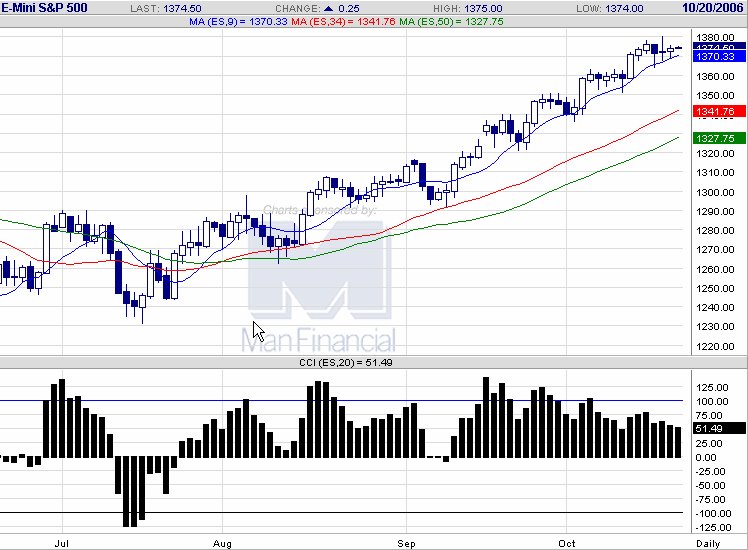
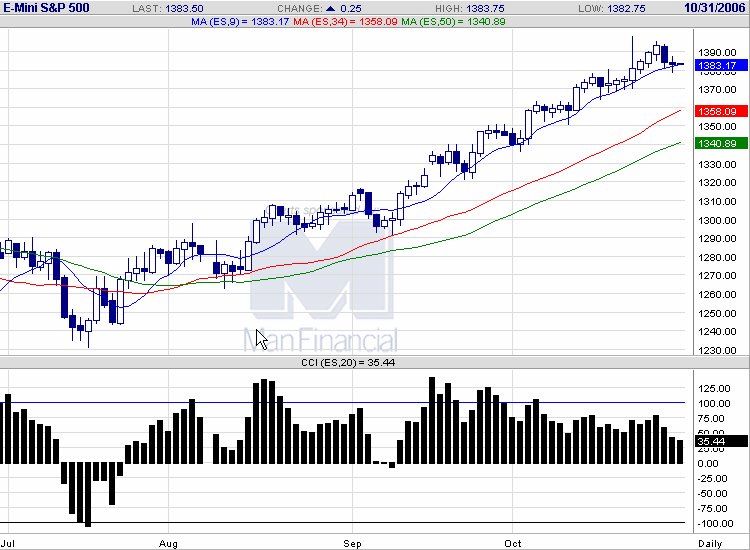
 20061030 ES looks to be finding support, might consolidate for a while before moving up.
  E-mini S&P 500 chart
posted by emacro @ 7:32 PM
0 comments
![]()
Chronicle of trading in ES S&P 500 index futures using momentum indicator CCI. Charts by www.futuresource.com. Note: The content here are for educational purposes only. Nothing in this blog constitute advice to buy or sell financial instruments and should not be construed as 'investment advice'.
20061030 ES looks to be finding support, might consolidate for a while before moving up.
E-mini S&P 500 chart
posted by emacro @ 7:32 PM
0 comments
![]()
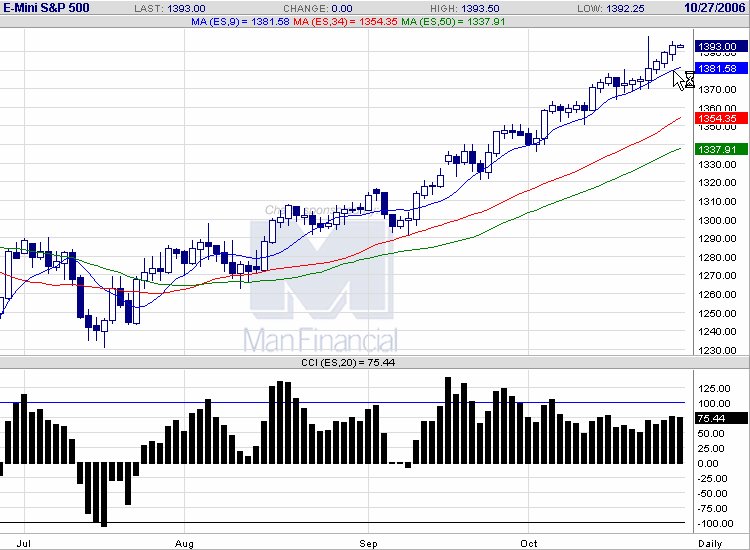
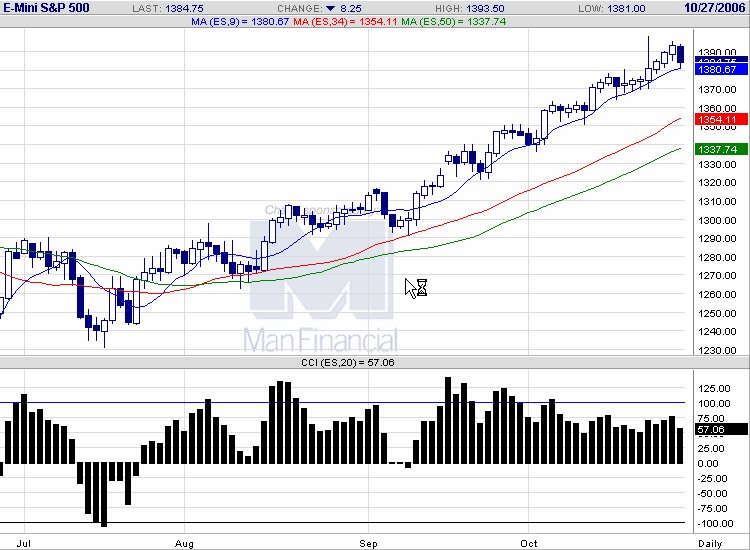 20061027 A potential bearish cndle. If selling continues, might see test of 1370 support.
E-mini S&P 500 chart
20061027 A potential bearish cndle. If selling continues, might see test of 1370 support.
E-mini S&P 500 chart
posted by emacro @ 6:02 PM
0 comments
![]()
 20061026 ES continues to move up. Need to be wary of divergence and any lows taken out on the dailies.
E-mini S&P 500 chart
20061026 ES continues to move up. Need to be wary of divergence and any lows taken out on the dailies.
E-mini S&P 500 chart
posted by emacro @ 6:06 PM
0 comments
![]()
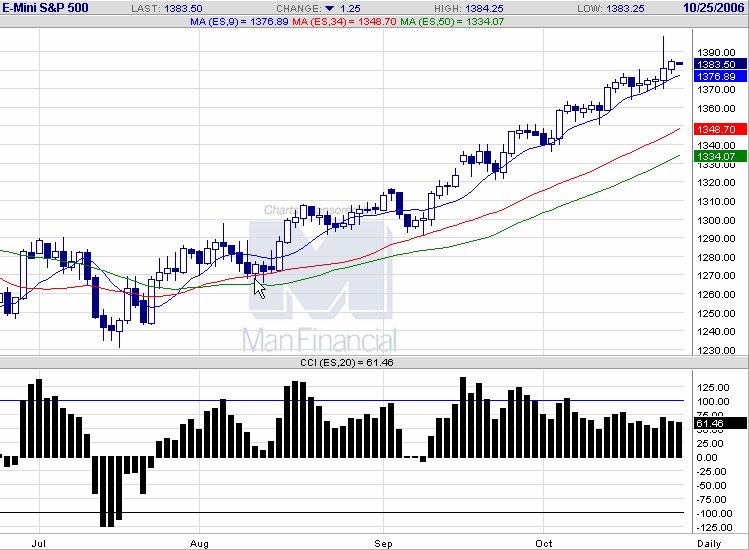 20061024 ES dominant candle 2 days ago, indicate sellers in control. Might look fo rshorts below the lows of that candlestick.
E-mini S&P 500 chart
20061024 ES dominant candle 2 days ago, indicate sellers in control. Might look fo rshorts below the lows of that candlestick.
E-mini S&P 500 chart
posted by emacro @ 8:49 PM
0 comments
![]()
posted by emacro @ 8:25 PM
0 comments
![]()
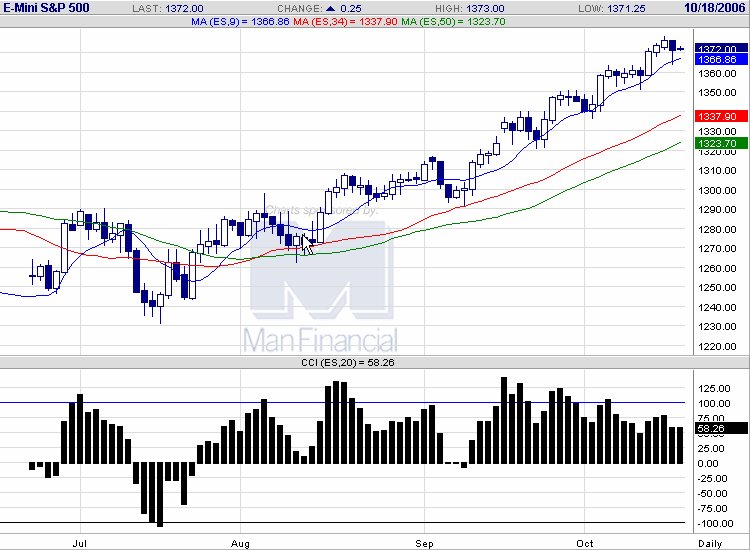
 20061018 ES on a day the DJIA went above 12,000. But the DJIA closes below 12,000.
E-mini S&P 500 chart
20061018 ES on a day the DJIA went above 12,000. But the DJIA closes below 12,000.
E-mini S&P 500 chart
posted by emacro @ 7:03 PM
0 comments
![]()
e
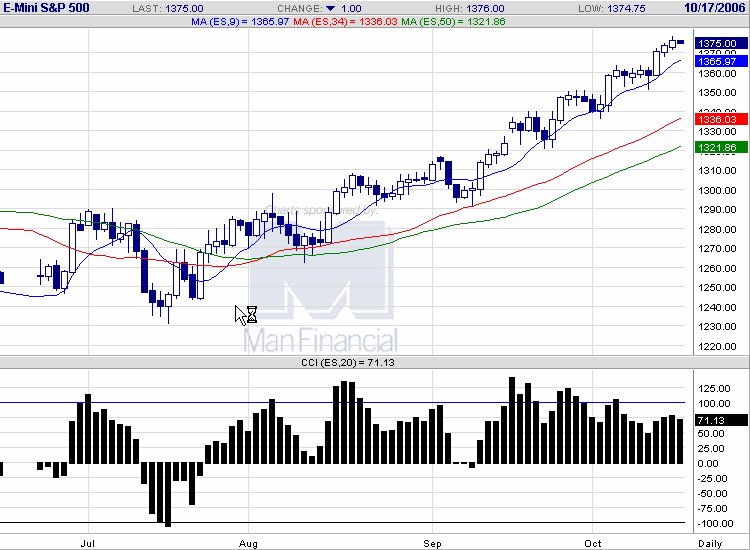
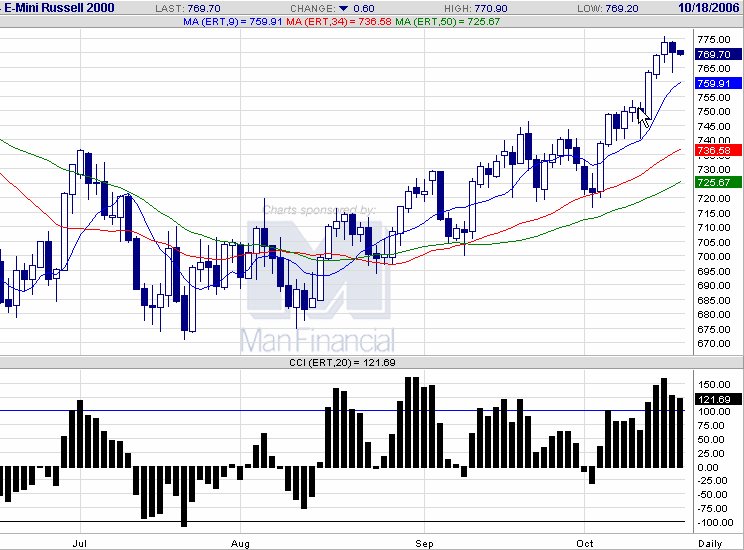 20061017 Buyers stepped in on lower levels of ER2 to push prices back up forming a 'shooting star' candlestick pattern. Need to look for lows of today to see if can hold else indications are for short.
E-mini S&P 500 chart
20061017 Buyers stepped in on lower levels of ER2 to push prices back up forming a 'shooting star' candlestick pattern. Need to look for lows of today to see if can hold else indications are for short.
E-mini S&P 500 chart
posted by emacro @ 5:43 PM
0 comments
![]()
 20061017 The observation of waning momentum we had yesterday, gave ample warning of today's correction.
E-mini S&P 500 chart
20061017 The observation of waning momentum we had yesterday, gave ample warning of today's correction.
E-mini S&P 500 chart
posted by emacro @ 5:42 PM
0 comments
![]()
 20061016 ES has shrinking candle bodies, which indicates momentum on upside slowing.
E-mini S&P 500 chart
20061016 ES has shrinking candle bodies, which indicates momentum on upside slowing.
E-mini S&P 500 chart
posted by emacro @ 8:06 PM
0 comments
![]()
posted by emacro @ 6:22 PM
0 comments
![]()
posted by emacro @ 5:56 PM
0 comments
![]()
posted by emacro @ 5:11 PM
0 comments
![]()
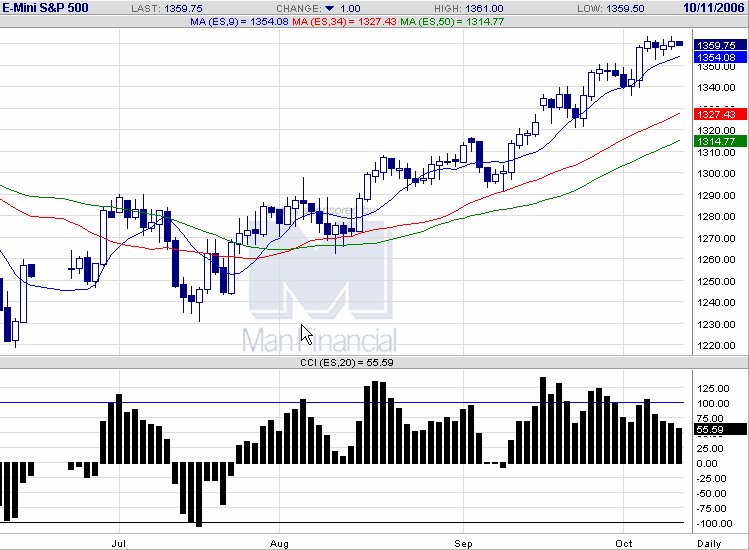
 20061011 ES continues tight range. of note is the late spike down and reversal off it, caused by news of the light plane crashing into a high rise apartment building in New York.
E-mini S&P 500 chart
20061011 ES continues tight range. of note is the late spike down and reversal off it, caused by news of the light plane crashing into a high rise apartment building in New York.
E-mini S&P 500 chart
posted by emacro @ 6:05 PM
0 comments
![]()
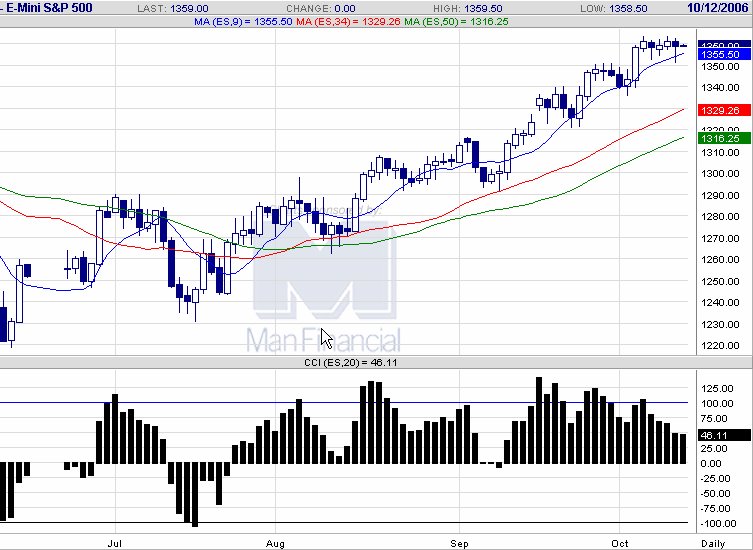
 20061010 Sideways action, but the cnadle bodies are small, indicating loss of momentum.
E-mini S&P 500 chart
20061010 Sideways action, but the cnadle bodies are small, indicating loss of momentum.
E-mini S&P 500 chart
posted by emacro @ 4:40 PM
0 comments
![]()
posted by emacro @ 6:29 PM
0 comments
![]()
posted by emacro @ 8:02 PM
0 comments
![]()
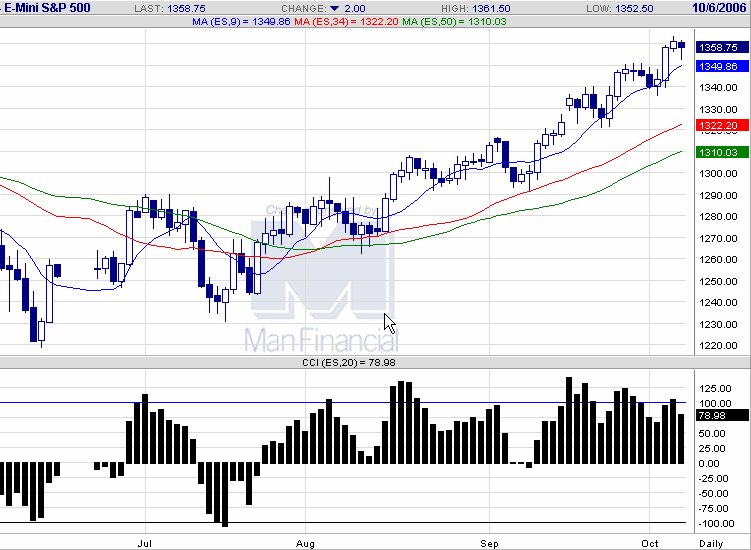
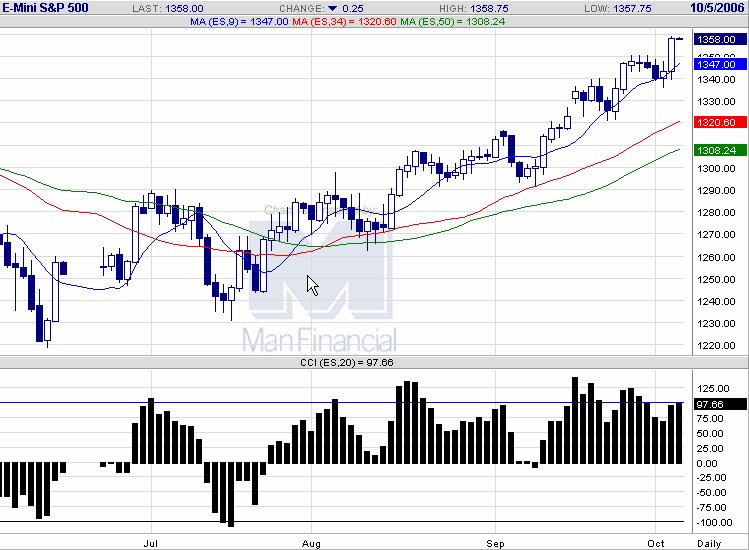
 20061005 With the DJIA another record close, a matter of whether the ES and other market indices catching up now.
E-mini S&P 500 chart
20061005 With the DJIA another record close, a matter of whether the ES and other market indices catching up now.
E-mini S&P 500 chart
posted by emacro @ 5:03 PM
0 comments
![]()
posted by emacro @ 5:44 PM
0 comments
![]()
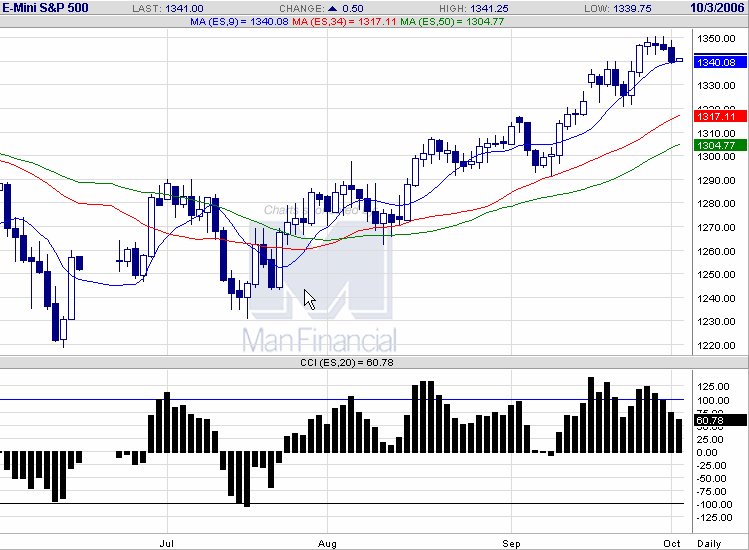
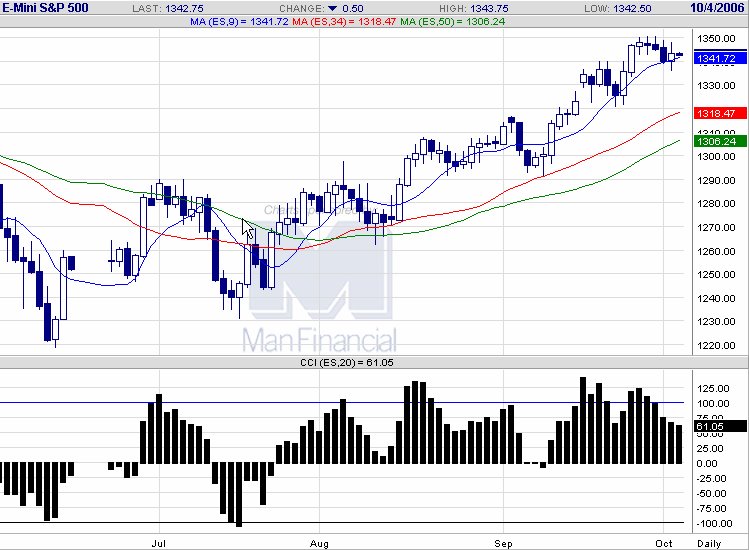 20061003 Dow Jones Industrials close at record high. ES looks like a bull flag forming.
E-mini S&P 500 chart
20061003 Dow Jones Industrials close at record high. ES looks like a bull flag forming.
E-mini S&P 500 chart
posted by emacro @ 5:07 PM
0 comments
![]()
 20061002 ES pulls back. If can maintain closes above 1335, the uptrend is still intact.
E-mini S&P 500 chart
20061002 ES pulls back. If can maintain closes above 1335, the uptrend is still intact.
E-mini S&P 500 chart
posted by emacro @ 5:41 PM
0 comments
![]()