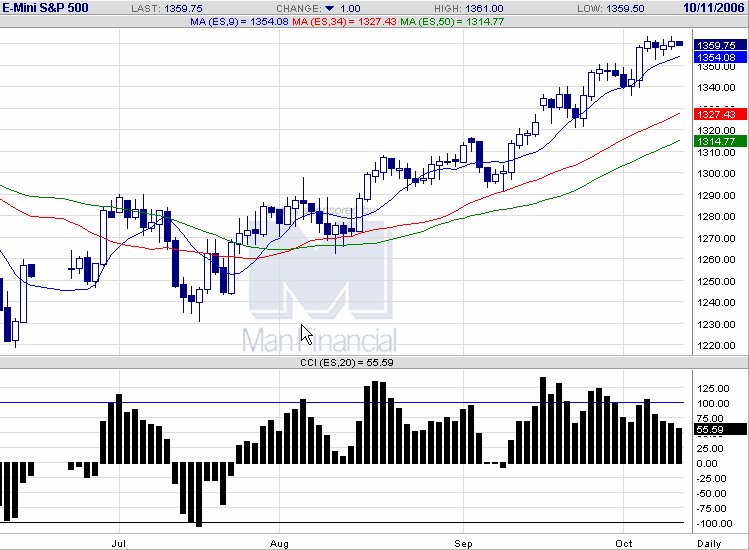
 20061010 Sideways action, but the cnadle bodies are small, indicating loss of momentum.
  E-mini S&P 500 chart
posted by emacro @ 4:40 PM
0 comments
![]()
Chronicle of trading in ES S&P 500 index futures using momentum indicator CCI. Charts by www.futuresource.com. Note: The content here are for educational purposes only. Nothing in this blog constitute advice to buy or sell financial instruments and should not be construed as 'investment advice'.
20061010 Sideways action, but the cnadle bodies are small, indicating loss of momentum.
E-mini S&P 500 chart
posted by emacro @ 4:40 PM
0 comments
![]()


0 Comments:
Post a Comment
<< Home