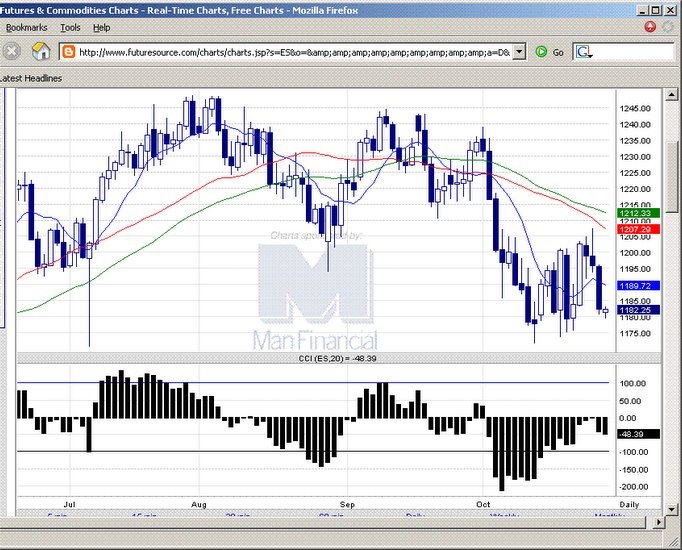
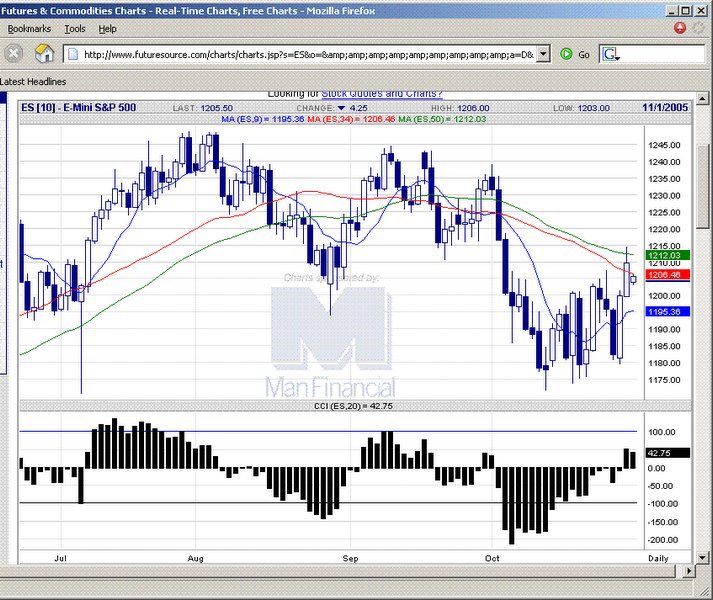
 2005103 Rally continues into resistance of the moving averages 1212 area, which might provide areas to short into for scalps.
  E-mini S&P 500 chart
posted by emacro @ 4:04 PM
0 comments
![]()
Chronicle of trading in ES S&P 500 index futures using momentum indicator CCI. Charts by www.futuresource.com. Note: The content here are for educational purposes only. Nothing in this blog constitute advice to buy or sell financial instruments and should not be construed as 'investment advice'.
2005103 Rally continues into resistance of the moving averages 1212 area, which might provide areas to short into for scalps.
E-mini S&P 500 chart
posted by emacro @ 4:04 PM
0 comments
![]()
 20051031 The ES option trade worked out, with no hassle, stress associated with the hurly burly world of daytrading for ticks.
E-mini S&P 500 chart
20051031 The ES option trade worked out, with no hassle, stress associated with the hurly burly world of daytrading for ticks.
E-mini S&P 500 chart
posted by emacro @ 3:54 PM
0 comments
![]()
 E-mini S&P 500 chart
posted by emacro @ 8:44 PM
0 comments
![]()
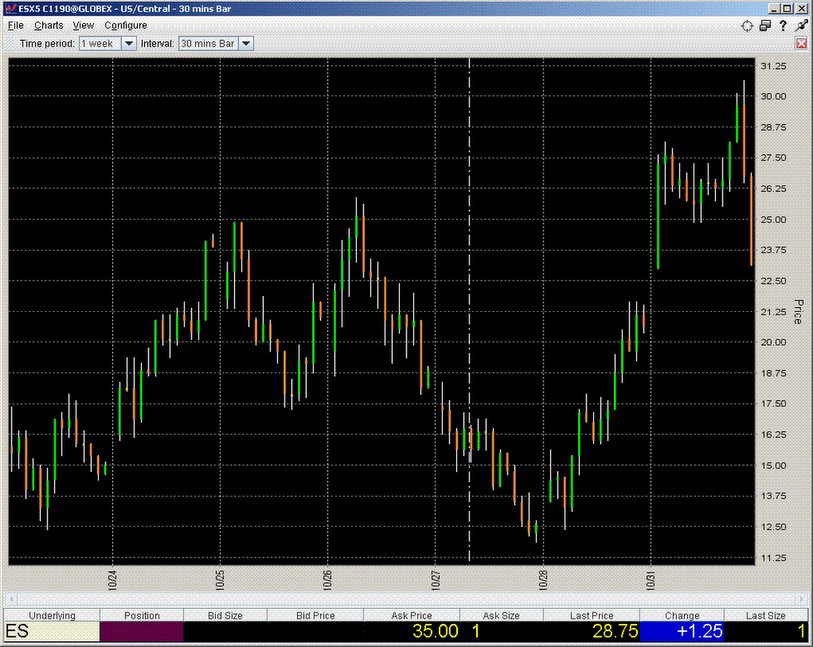
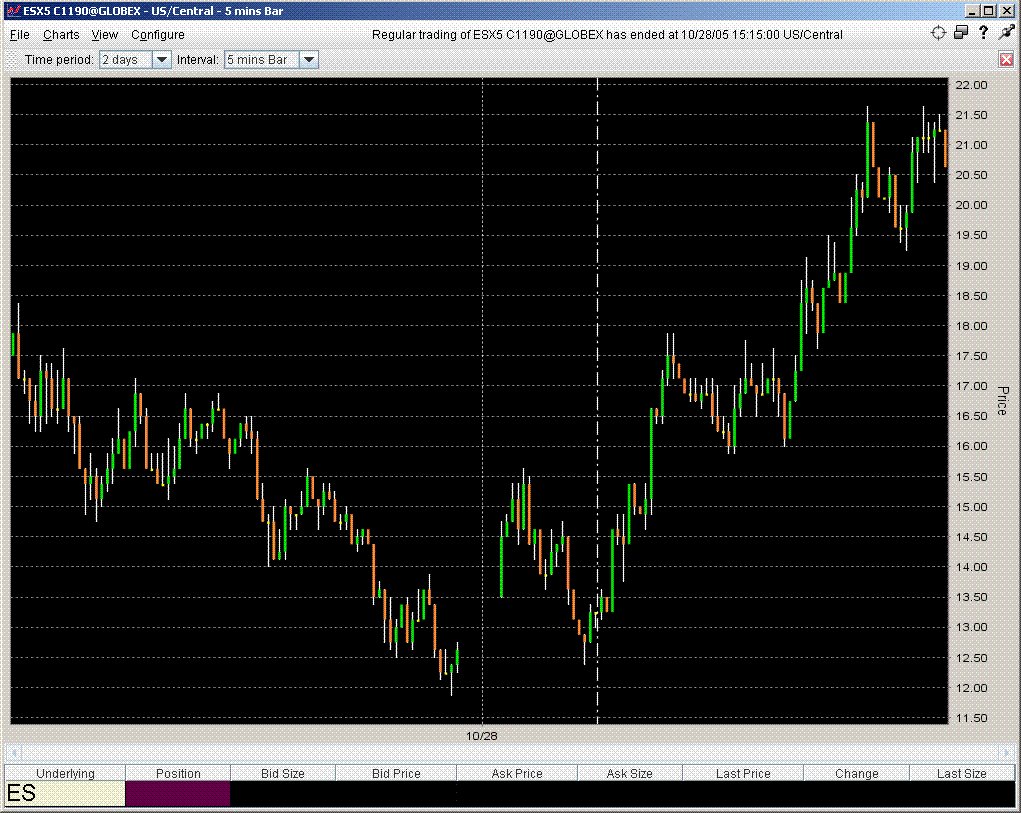
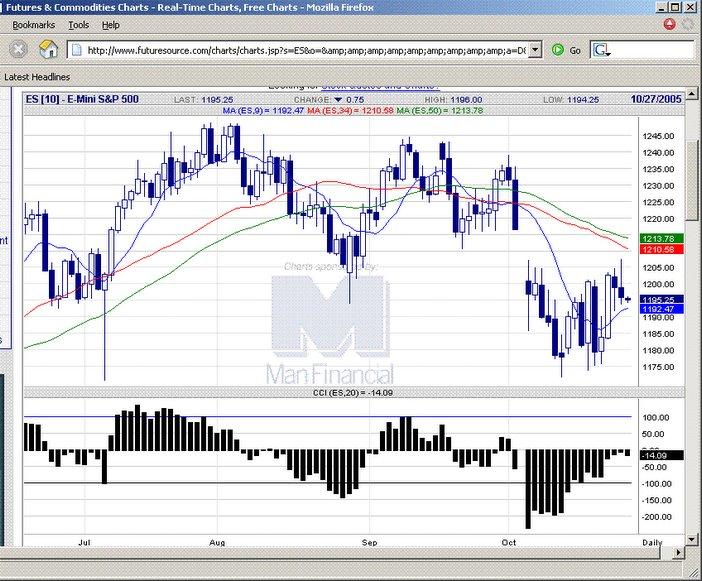
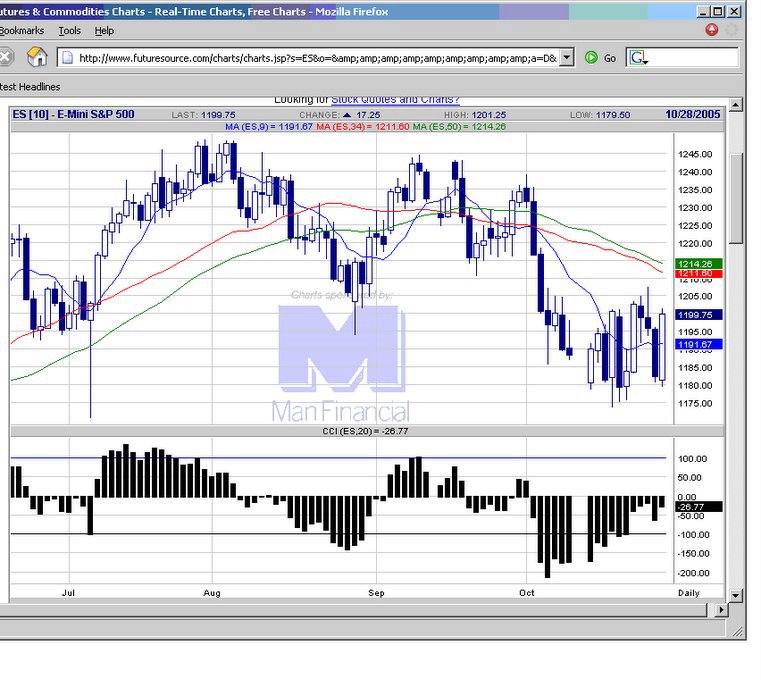 20051028 Engulfing Bullish candlestick, however the ES is in a big range with lots of volatility, which is a sign of a change in trend or impending big move. Anticipate a move of 10% either way.
E-mini S&P 500 chart
20051028 Engulfing Bullish candlestick, however the ES is in a big range with lots of volatility, which is a sign of a change in trend or impending big move. Anticipate a move of 10% either way.
E-mini S&P 500 chart
posted by emacro @ 6:53 PM
0 comments
![]()
posted by emacro @ 8:20 PM
0 comments
![]()
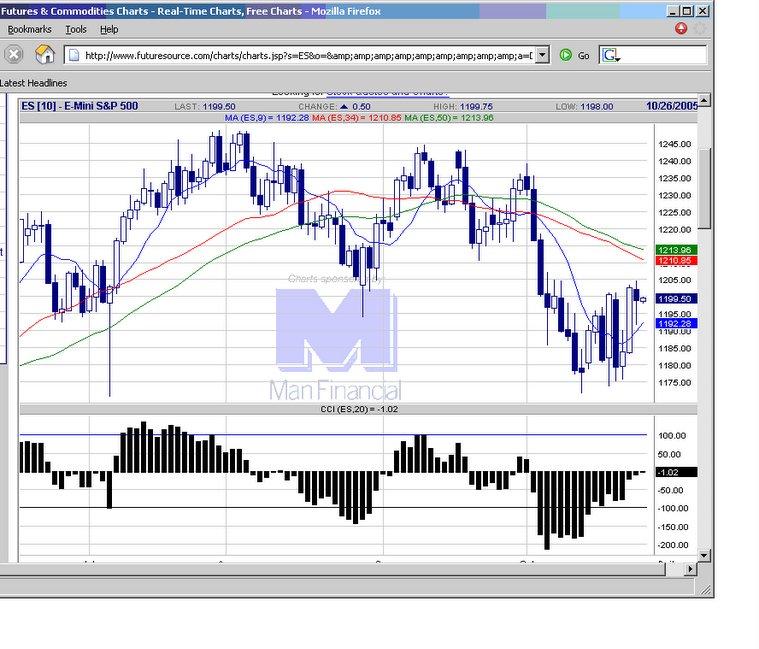
 20051026 Testing moving average support, with a bullish continuation pattern forming. Look to buy into support at the moving average for next leg up.
E-mini S&P 500 chart
20051026 Testing moving average support, with a bullish continuation pattern forming. Look to buy into support at the moving average for next leg up.
E-mini S&P 500 chart
posted by emacro @ 5:36 PM
0 comments
![]()
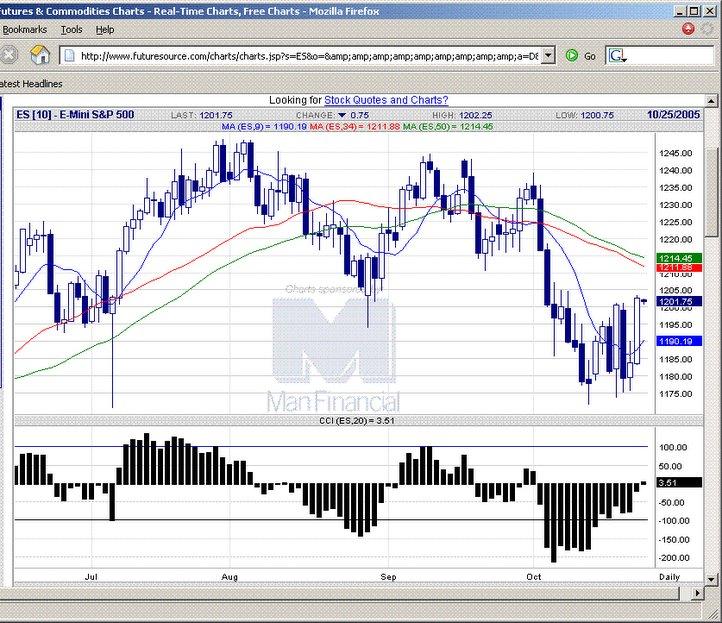
 20051025 A welcome pause after the volatility of the past few sessions, could continue upwards.
E-mini S&P 500 chart
20051025 A welcome pause after the volatility of the past few sessions, could continue upwards.
E-mini S&P 500 chart
posted by emacro @ 9:21 PM
0 comments
![]()
 20051024 A breakout of the ID pattern to the upside with strong rally ensuing. The nomination for appointment as FOMC Chairman of Ben Bernanke, was the driving force behind the rally. Looking for more strength early Tuesday trade.
E-mini S&P 500 chart
20051024 A breakout of the ID pattern to the upside with strong rally ensuing. The nomination for appointment as FOMC Chairman of Ben Bernanke, was the driving force behind the rally. Looking for more strength early Tuesday trade.
E-mini S&P 500 chart
posted by emacro @ 4:19 PM
0 comments
![]()
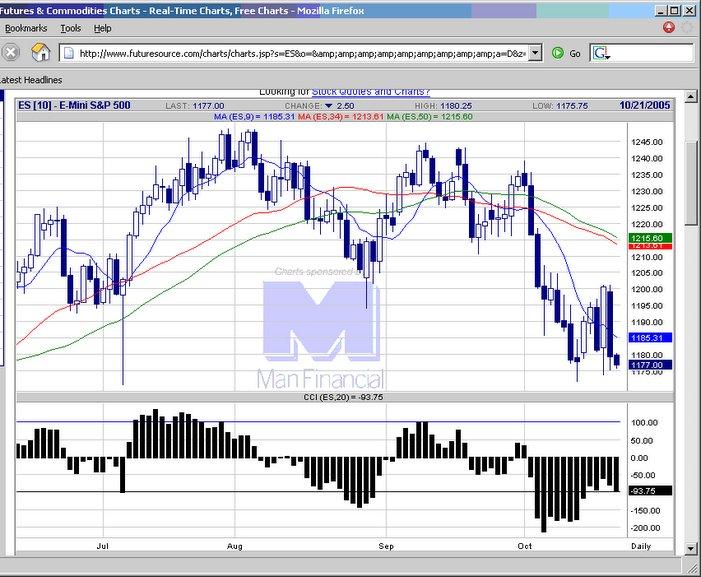
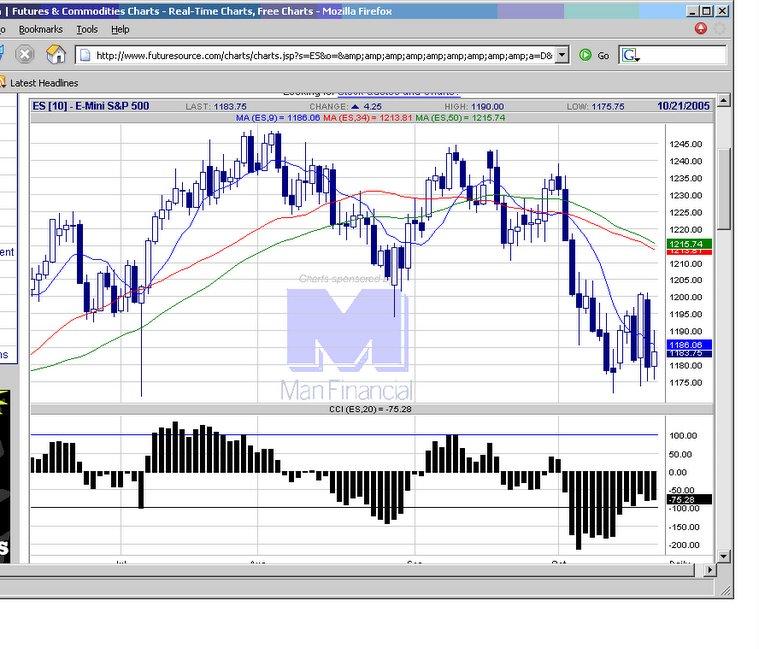 20051021 A second consecutive ID, however the range is 1190-1175. Be on the lookout for breakout either side.
E-mini S&P 500 chart
20051021 A second consecutive ID, however the range is 1190-1175. Be on the lookout for breakout either side.
E-mini S&P 500 chart
posted by emacro @ 6:25 PM
0 comments
![]()
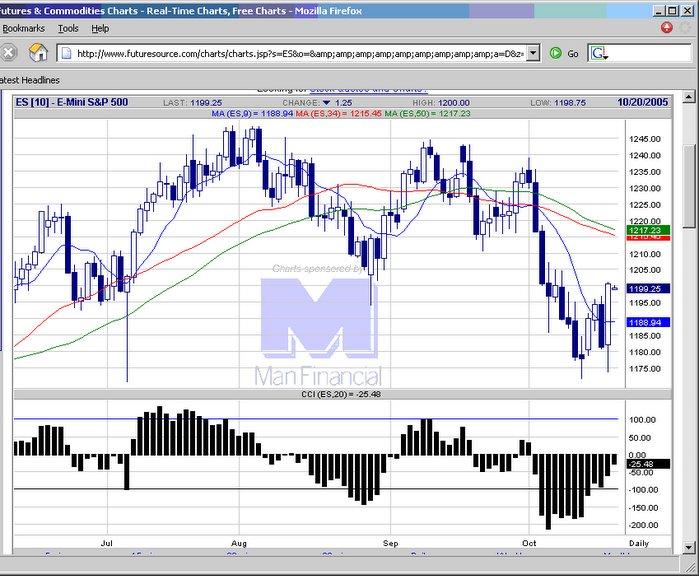
 20051020 Not even a hint o the expected strength on the opening, with small gap down, with no way back after that, closing near lows. Seems the CCI momentum is the dominant theme and overpowering the bottom pickers.
E-mini S&P 500 chart
20051020 Not even a hint o the expected strength on the opening, with small gap down, with no way back after that, closing near lows. Seems the CCI momentum is the dominant theme and overpowering the bottom pickers.
E-mini S&P 500 chart
posted by emacro @ 5:36 PM
0 comments
![]()
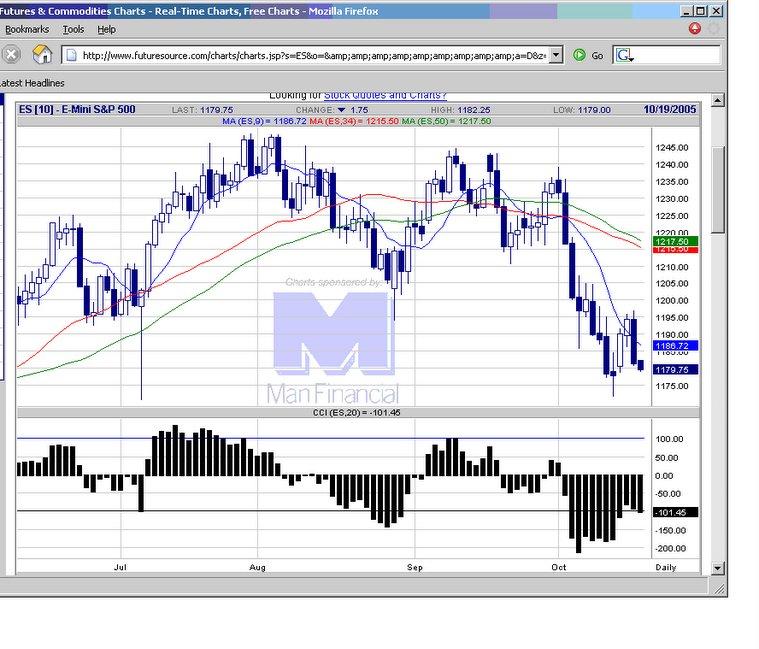
 20051019 Candlestick indicates strong buying, overwhelming those 'shorts of the century' types.
E-mini S&P 500 chart
20051019 Candlestick indicates strong buying, overwhelming those 'shorts of the century' types.
E-mini S&P 500 chart
posted by emacro @ 4:59 PM
0 comments
![]()
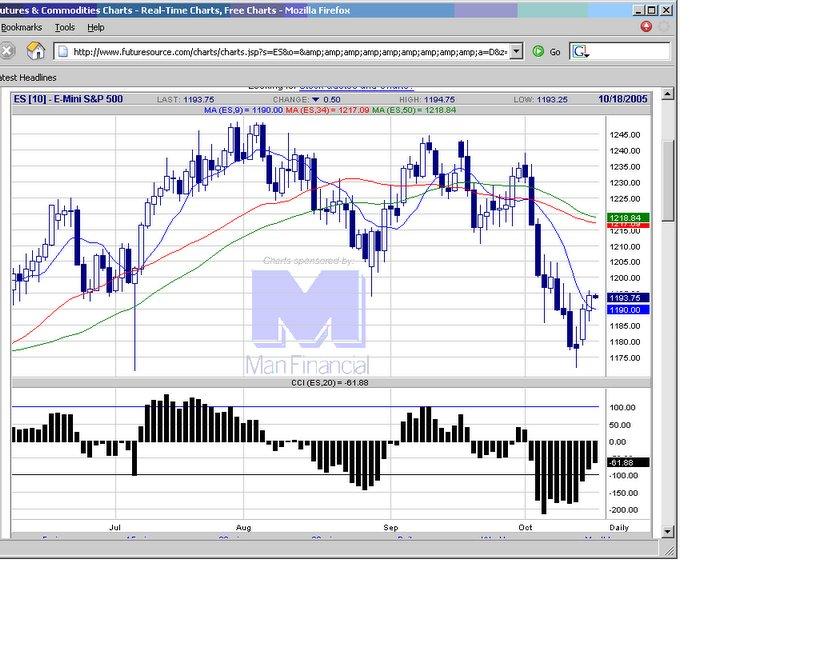
 20051018 The rebound fizzled out. CCI momentum downside takes over and the downtrend resumes.
E-mini S&P 500 chart
20051018 The rebound fizzled out. CCI momentum downside takes over and the downtrend resumes.
E-mini S&P 500 chart
posted by emacro @ 5:05 PM
0 comments
![]()
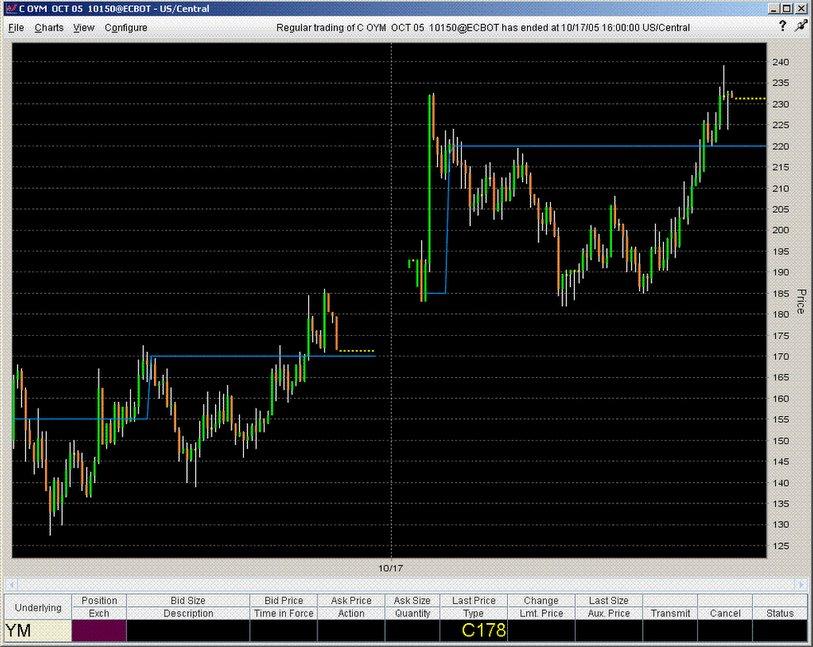
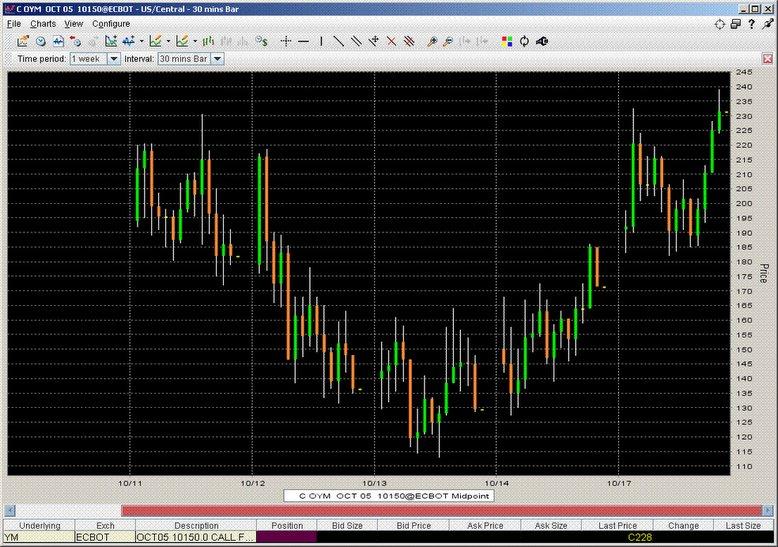 20051017 So the option play identified in the YM 10150 Oct calls are shown in the 30 min chart.
E-mini S&P 500 chart
20051017 So the option play identified in the YM 10150 Oct calls are shown in the 30 min chart.
E-mini S&P 500 chart
posted by emacro @ 10:48 PM
0 comments
![]()
 20051017 As expected, the rally continues into the morning and holds gains into close. Waiting for next opportunity for a trade.
E-mini S&P 500 chart
20051017 As expected, the rally continues into the morning and holds gains into close. Waiting for next opportunity for a trade.
E-mini S&P 500 chart
posted by emacro @ 4:57 PM
0 comments
![]()
posted by emacro @ 4:55 PM
0 comments
![]()
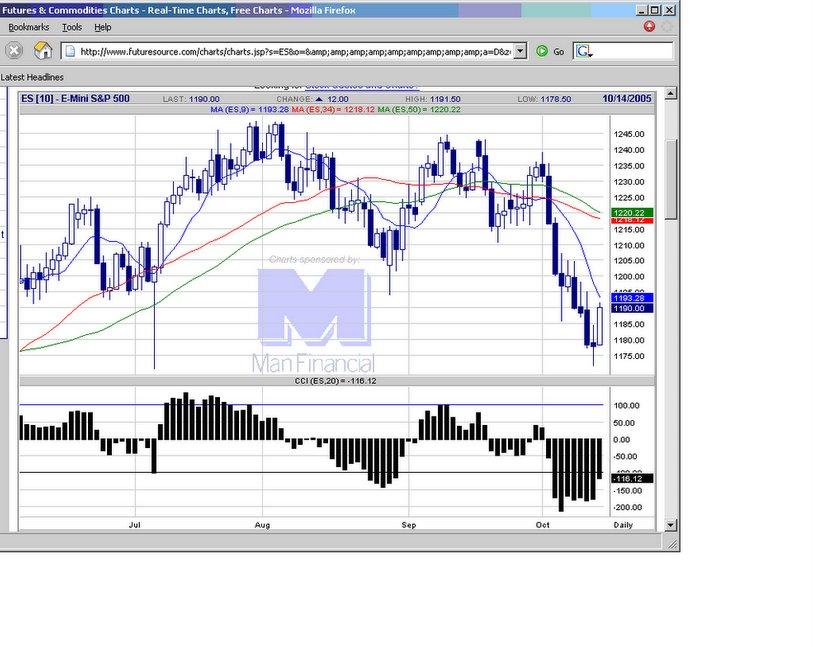 20051014 Nice reward for option positions with bullish stance. Rally fueled by short covering. Rally should continue, at least for the first part of Monday morning.
E-mini S&P 500 chart
20051014 Nice reward for option positions with bullish stance. Rally fueled by short covering. Rally should continue, at least for the first part of Monday morning.
E-mini S&P 500 chart
posted by emacro @ 7:54 PM
0 comments
![]()
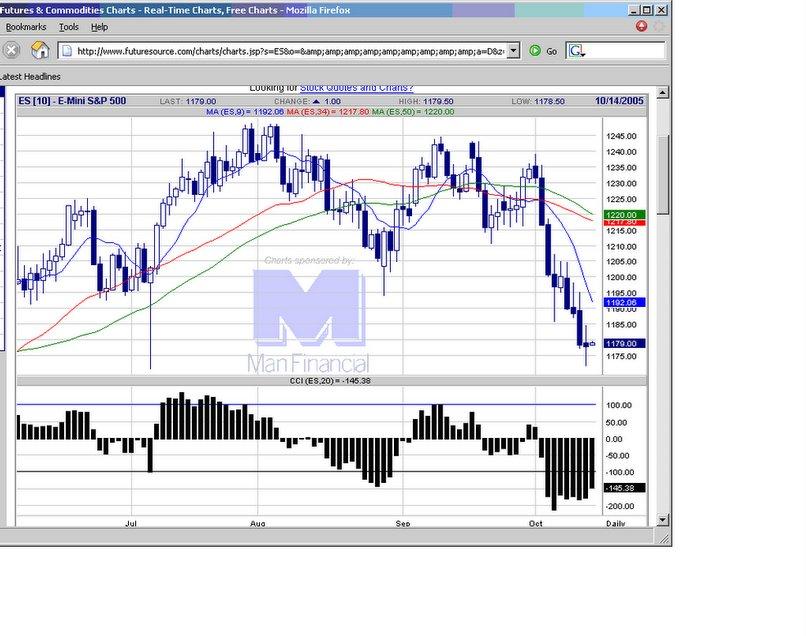 2001013 A big doji candlestick indicates indecision, with balance between buls and bears. Could be the support has been put in.
E-mini S&P 500 chart
2001013 A big doji candlestick indicates indecision, with balance between buls and bears. Could be the support has been put in.
E-mini S&P 500 chart
posted by emacro @ 5:07 PM
0 comments
![]()
posted by emacro @ 4:58 PM
0 comments
![]()
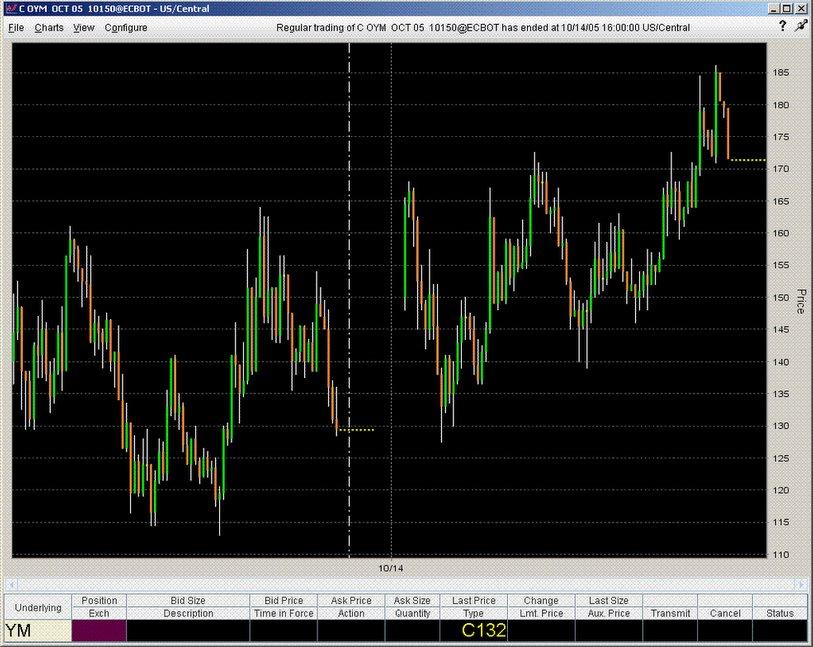
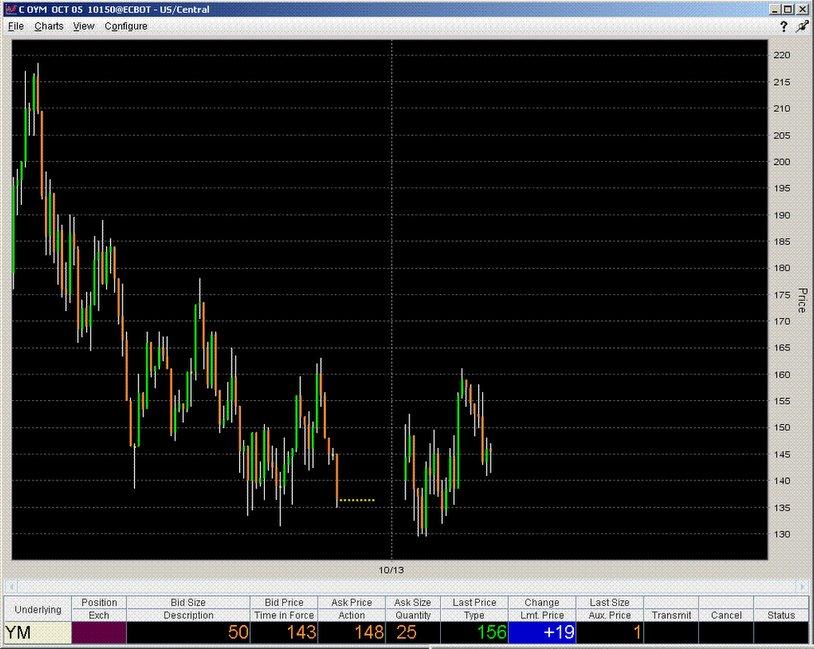 2005014 The mini Dow YM 10150 Oct calls n the YM utures contract looks intereting for longs to take advantage of the view of the rebound looming after 9 straight days of selling.
E-mini S&P 500 chart
2005014 The mini Dow YM 10150 Oct calls n the YM utures contract looks intereting for longs to take advantage of the view of the rebound looming after 9 straight days of selling.
E-mini S&P 500 chart
posted by emacro @ 8:21 AM
0 comments
![]()
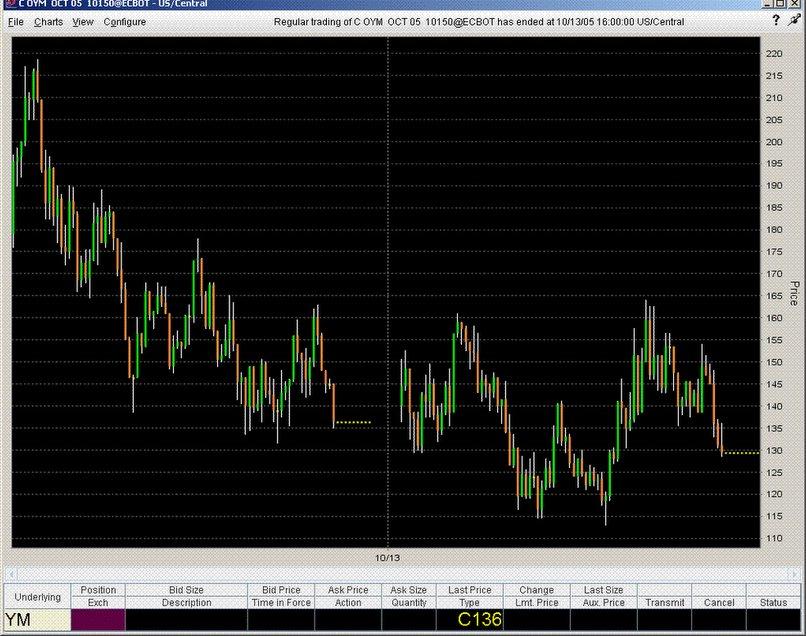
 20051012 CCI moves to downside, indicating strong momentum down resulting in another down day. Count about 9 consecutive days, so should be ready for a bounce higher. Can take some call options on the ES or YM to take advantage of extreme weakness on the opening tomorrow.
E-mini S&P 500 chart
20051012 CCI moves to downside, indicating strong momentum down resulting in another down day. Count about 9 consecutive days, so should be ready for a bounce higher. Can take some call options on the ES or YM to take advantage of extreme weakness on the opening tomorrow.
E-mini S&P 500 chart
posted by emacro @ 5:03 PM
0 comments
![]()
20051011 Faiure to hold the highs indicate a weak market. But could be opportunity to long for a bounce, look for the turtle soup reversal.
 E-mini S&P 500 chart
posted by emacro @ 9:28 PM
0 comments
![]()
posted by emacro @ 6:35 PM
0 comments
![]()
posted by emacro @ 7:11 PM
0 comments
![]()