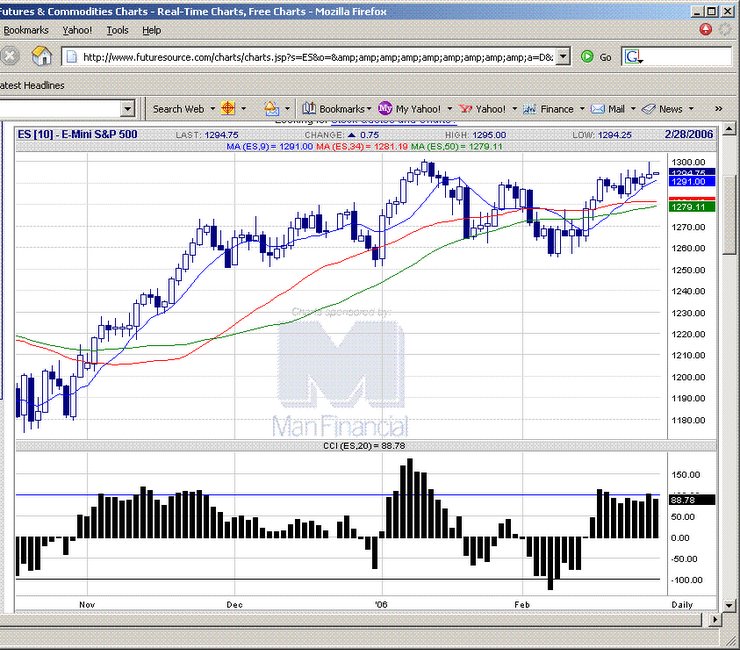
 20060228 Cluster of longer term moving averages support for the ES. Needs to hold above these and 1278 remains key. Below, could accelerate downside moves.
  E-mini S&P 500 chart
posted by emacro @ 4:47 PM
0 comments
![]()
Chronicle of trading in ES S&P 500 index futures using momentum indicator CCI. Charts by www.futuresource.com. Note: The content here are for educational purposes only. Nothing in this blog constitute advice to buy or sell financial instruments and should not be construed as 'investment advice'.
20060228 Cluster of longer term moving averages support for the ES. Needs to hold above these and 1278 remains key. Below, could accelerate downside moves.
E-mini S&P 500 chart
posted by emacro @ 4:47 PM
0 comments
![]()
posted by emacro @ 4:15 PM
0 comments
![]()
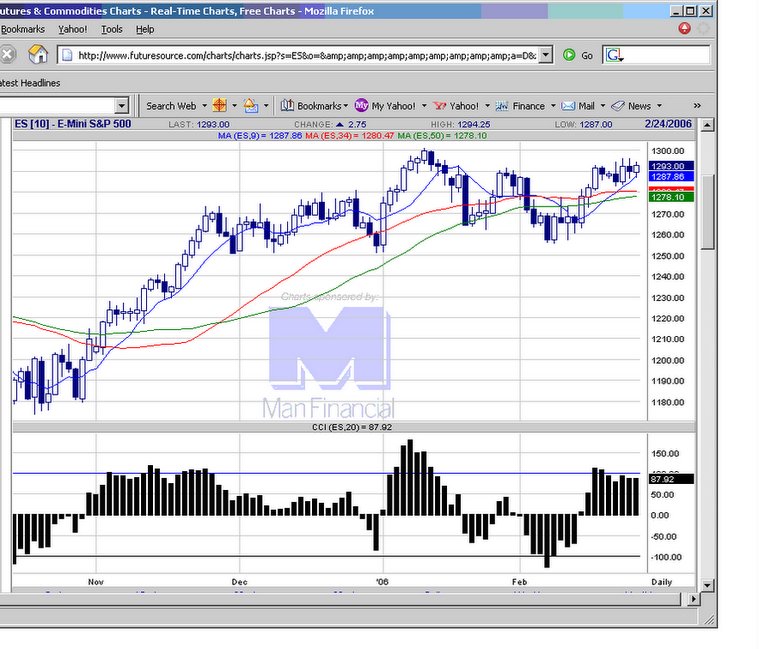 20060224 Unlike the Russell 2000, ES remains indecisie on movement, within trading range.
E-mini S&P 500 chart
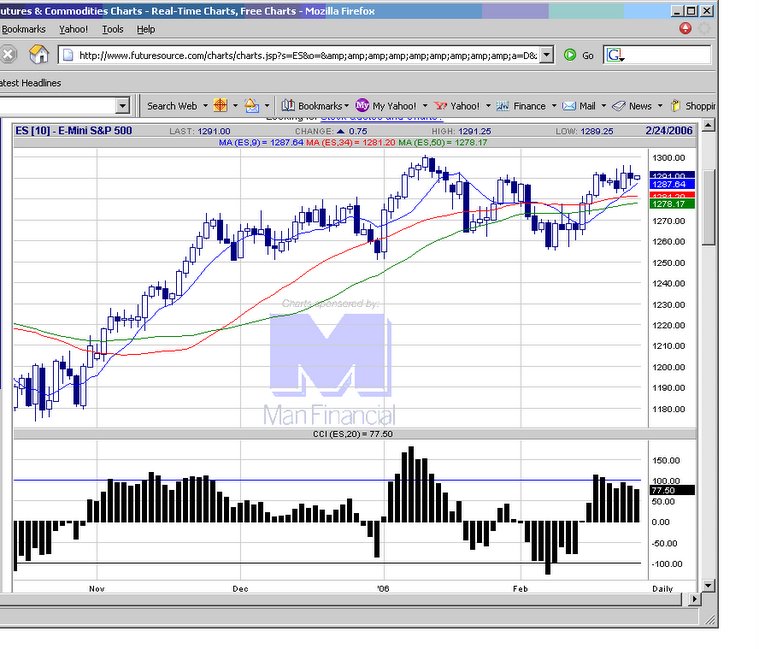
20060224 Unlike the Russell 2000, ES remains indecisie on movement, within trading range.
E-mini S&P 500 chart
posted by emacro @ 6:37 PM
0 comments
![]()
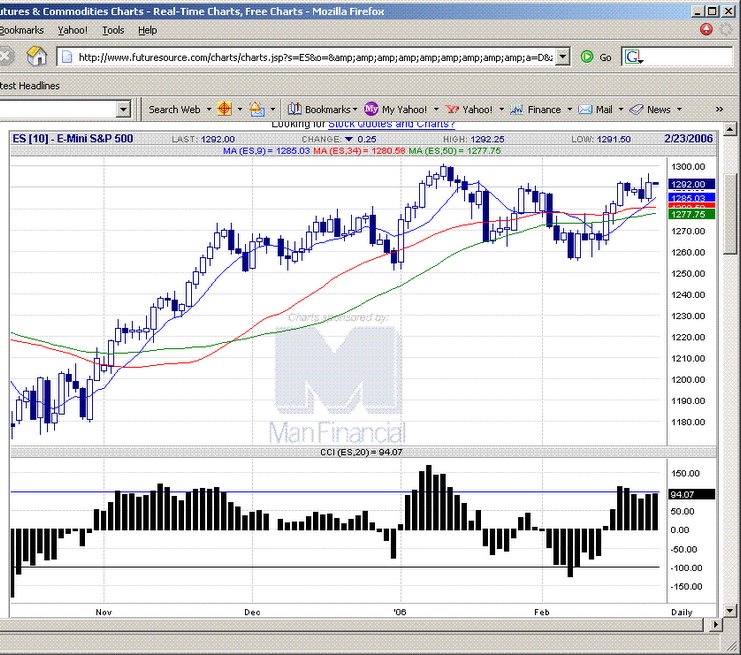
 20060223 As expected, unable to make headway trading in a range still. 1260-1290.
E-mini S&P 500 chart
20060223 As expected, unable to make headway trading in a range still. 1260-1290.
E-mini S&P 500 chart
posted by emacro @ 3:36 PM
0 comments
![]()
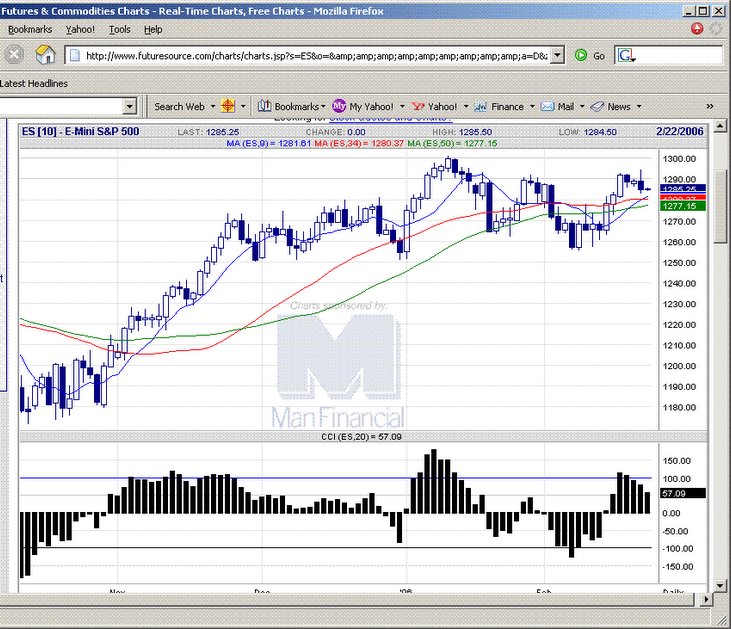
 20060222 Strong rebound takes ES to close above recent range. Test will come tonight to see if can hold above. CCI momentum is positive.
E-mini S&P 500 chart
20060222 Strong rebound takes ES to close above recent range. Test will come tonight to see if can hold above. CCI momentum is positive.
E-mini S&P 500 chart
posted by emacro @ 4:09 PM
0 comments
![]()
 20060221 Big shadow on the candlestick shows some selling interest, could range trade back into the range 1260-1290.
E-mini S&P 500 chart
20060221 Big shadow on the candlestick shows some selling interest, could range trade back into the range 1260-1290.
E-mini S&P 500 chart
posted by emacro @ 4:12 PM
0 comments
![]()
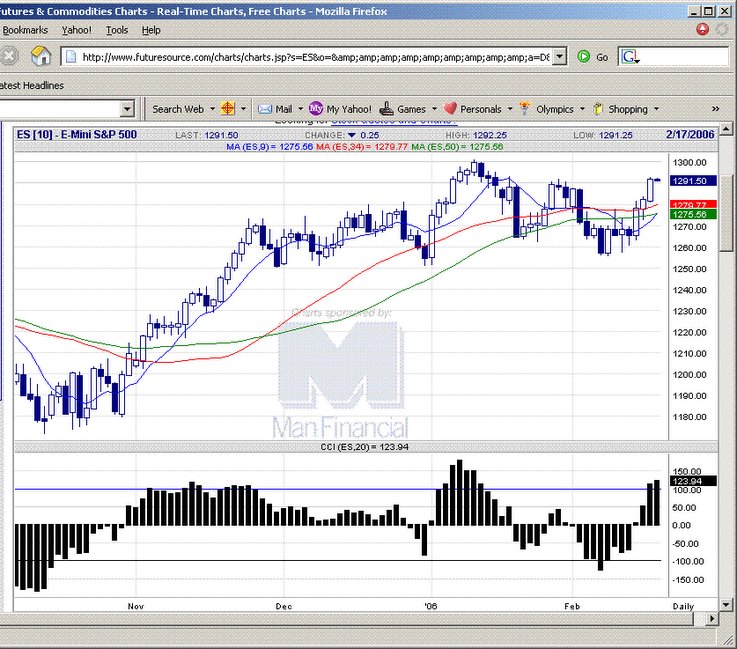
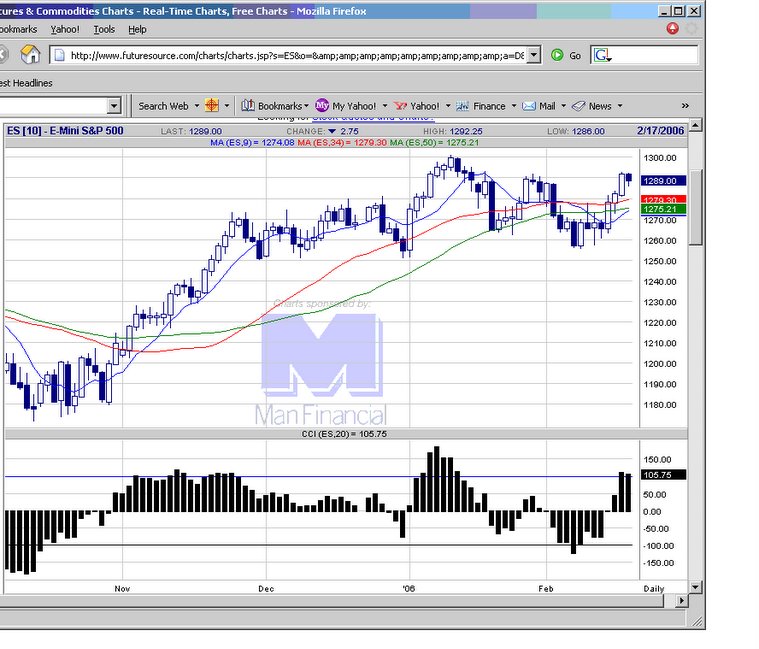 20060217 1260 to 1290 range. Upper resistance is confirmed somewhat form today's failure to maintain above 1290.
E-mini S&P 500 chart
20060217 1260 to 1290 range. Upper resistance is confirmed somewhat form today's failure to maintain above 1290.
E-mini S&P 500 chart
posted by emacro @ 5:22 PM
0 comments
![]()
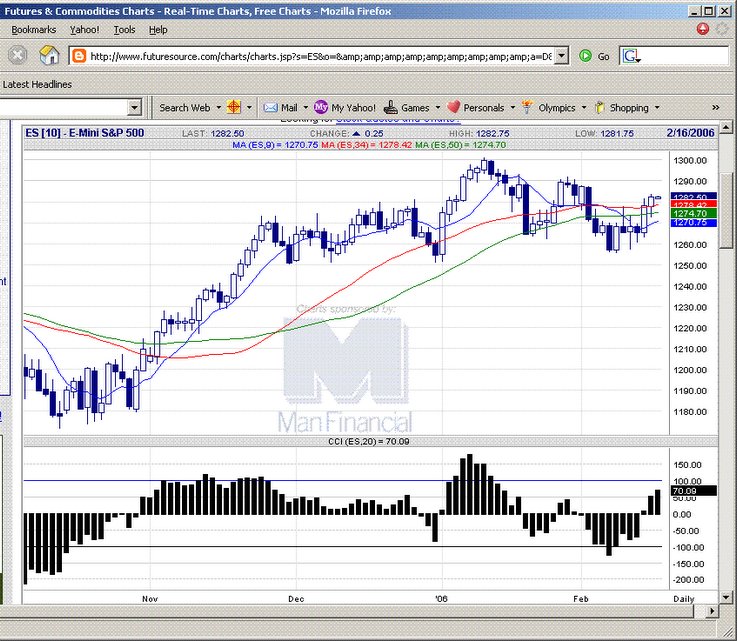
 20060216 Rallies above key 1290 level and closes beyond. Paves the way for further gains.
E-mini S&P 500 chart
20060216 Rallies above key 1290 level and closes beyond. Paves the way for further gains.
E-mini S&P 500 chart
posted by emacro @ 4:06 PM
0 comments
![]()
 20060215 Trading range looks to be 1260-1290, watching the economic releases, just like Bernanke.
E-mini S&P 500 chart
20060215 Trading range looks to be 1260-1290, watching the economic releases, just like Bernanke.
E-mini S&P 500 chart
posted by emacro @ 4:15 PM
0 comments
![]()
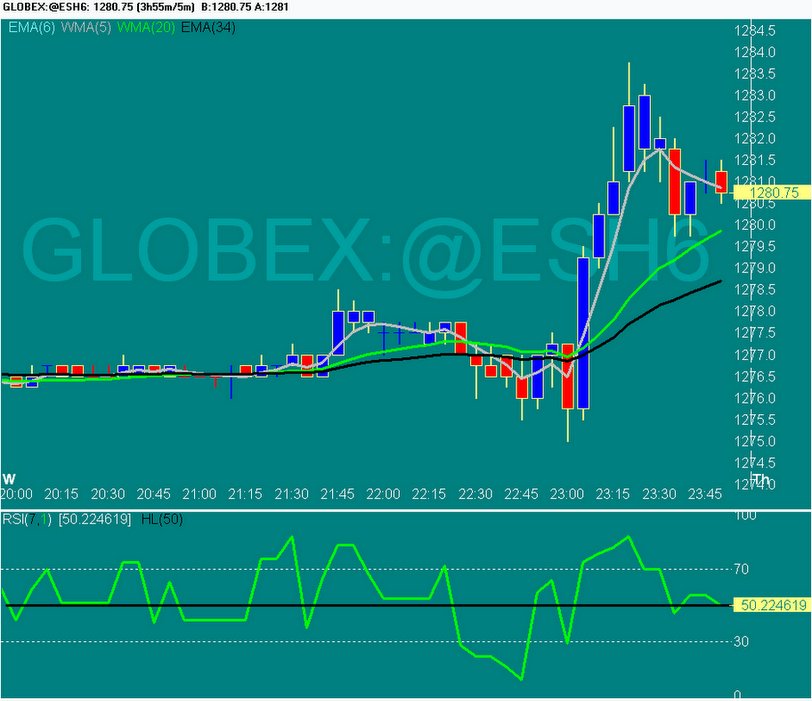 20060215 Ben Bernanke's first testimony to Congress had a spiking effect on the ES (S&P 500 e-mini futures)
E-mini S&P 500 chart
20060215 Ben Bernanke's first testimony to Congress had a spiking effect on the ES (S&P 500 e-mini futures)
E-mini S&P 500 chart
posted by emacro @ 7:54 AM
0 comments
![]()
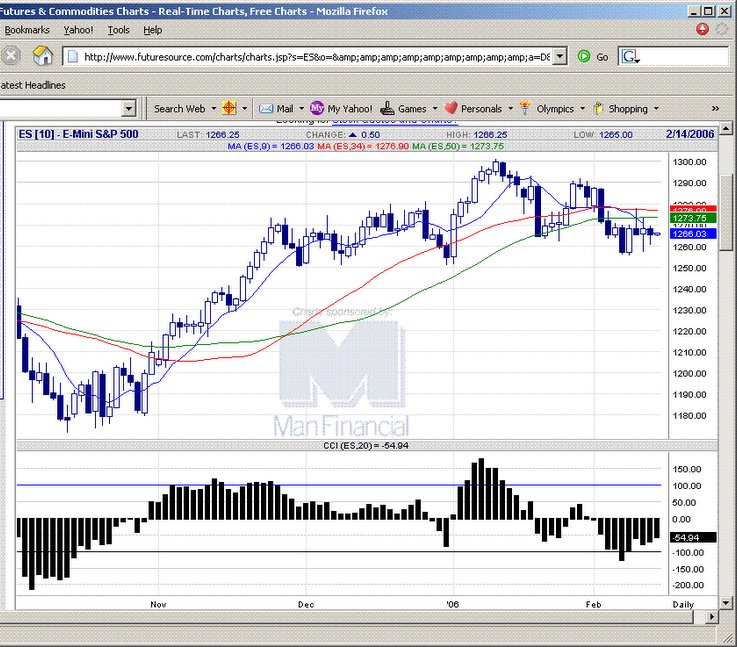
 20060214 Goes thrugh upside band, but unable to sustain the breakout. The next sessions will see whether the berakout can take the ES higher.
E-mini S&P 500 chart
20060214 Goes thrugh upside band, but unable to sustain the breakout. The next sessions will see whether the berakout can take the ES higher.
E-mini S&P 500 chart
posted by emacro @ 4:19 PM
0 comments
![]()
 20060213 Still cribing sideways consolidation. Watching the key moving averages above the market for breakout.
E-mini S&P 500 chart
20060213 Still cribing sideways consolidation. Watching the key moving averages above the market for breakout.
E-mini S&P 500 chart
posted by emacro @ 4:41 PM
0 comments
![]()
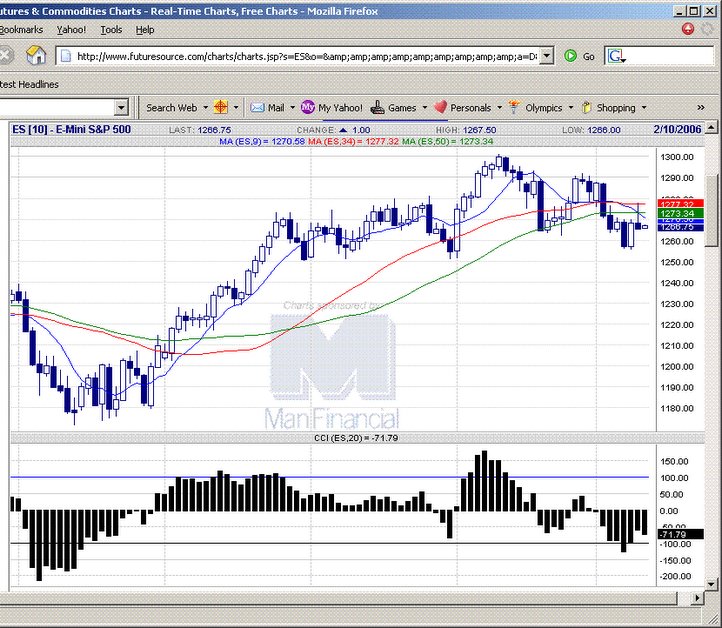
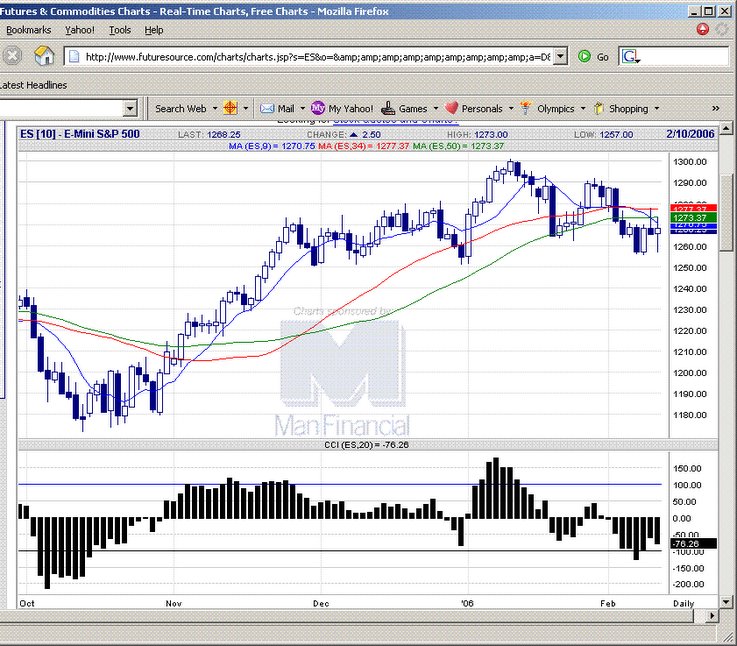 20060210 H&S pattern looks like stalling into sideways consolidation now. Range 1255-1275. Look for breakout of this range.
E-mini S&P 500 chart
20060210 H&S pattern looks like stalling into sideways consolidation now. Range 1255-1275. Look for breakout of this range.
E-mini S&P 500 chart
posted by emacro @ 5:16 PM
0 comments
![]()
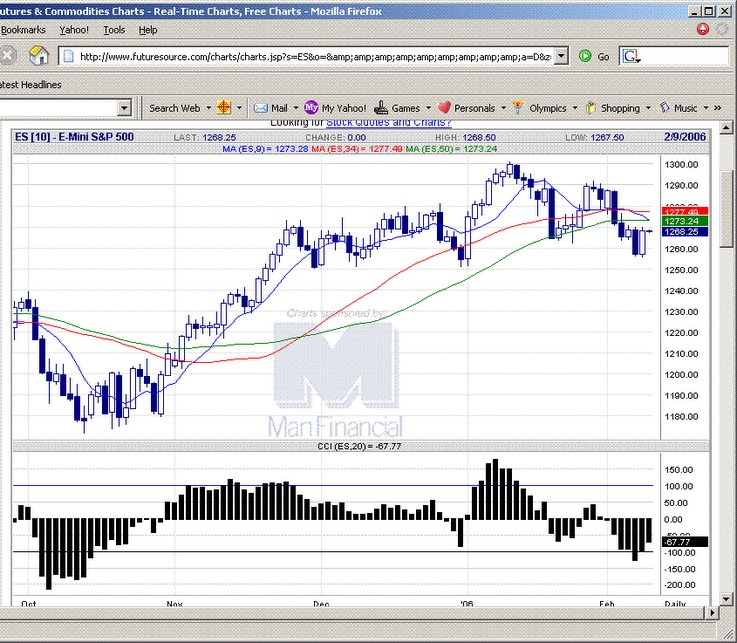
 20060209 Rallies into key moving averages, which proved resistance levels strong. H&S still in play, judging from the price action, with CCI momentum building to downside.
E-mini S&P 500 chart
20060209 Rallies into key moving averages, which proved resistance levels strong. H&S still in play, judging from the price action, with CCI momentum building to downside.
E-mini S&P 500 chart
posted by emacro @ 4:23 PM
0 comments
![]()
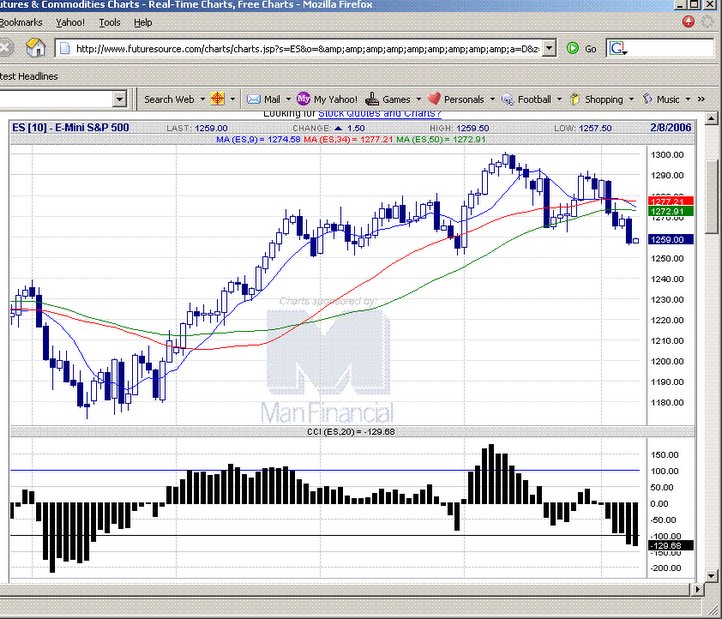
 20060208 Retraces back the losses from the previous day. Could be the expected retest of the neckline prelude to the move to the target.
E-mini S&P 500 chart
20060208 Retraces back the losses from the previous day. Could be the expected retest of the neckline prelude to the move to the target.
E-mini S&P 500 chart
posted by emacro @ 3:57 PM
0 comments
![]()
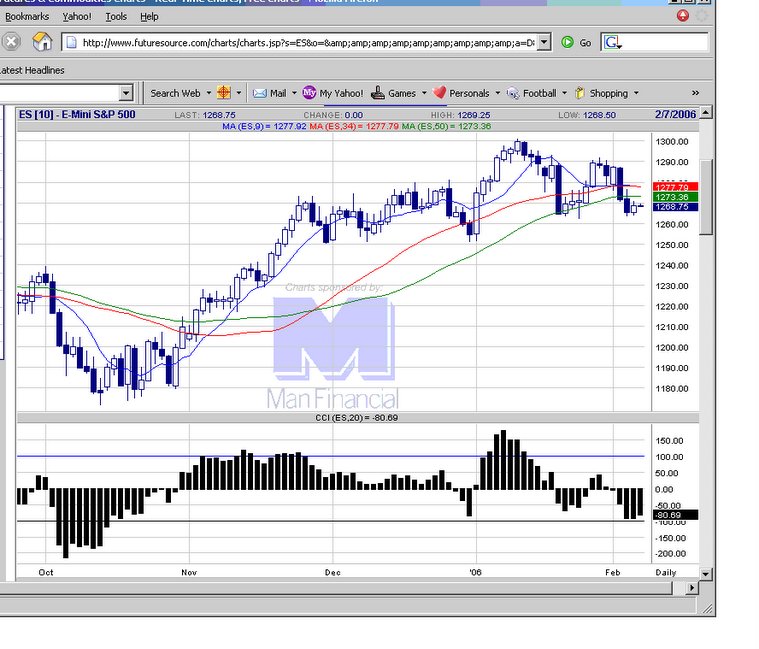
 20060207 With the selling candlestick today, the H&S triggers, targets the height of the head, which might target about 1235. 1272 now becomes major resistance.
E-mini S&P 500 chart
20060207 With the selling candlestick today, the H&S triggers, targets the height of the head, which might target about 1235. 1272 now becomes major resistance.
E-mini S&P 500 chart
posted by emacro @ 3:36 PM
0 comments
![]()
 20060206 Waiting for the outcome of the possible H&S, which it seems forming. The markets now move out of earnings season to focus on interest rates, with new FOMC chairman Bernanke likely to provide some uncertain volatile markets.
E-mini S&P 500 chart
20060206 Waiting for the outcome of the possible H&S, which it seems forming. The markets now move out of earnings season to focus on interest rates, with new FOMC chairman Bernanke likely to provide some uncertain volatile markets.
E-mini S&P 500 chart
posted by emacro @ 3:43 PM
0 comments
![]()
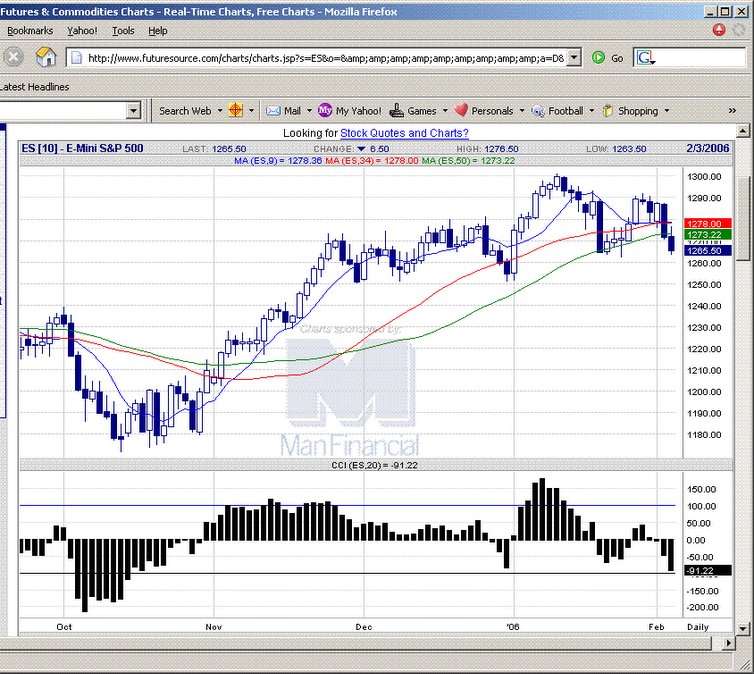 20060203 Possibly forming a H&S formation, which is bearish, after closing below the key 1272 level.
E-mini S&P 500 chart
20060203 Possibly forming a H&S formation, which is bearish, after closing below the key 1272 level.
E-mini S&P 500 chart
posted by emacro @ 6:15 PM
0 comments
![]()
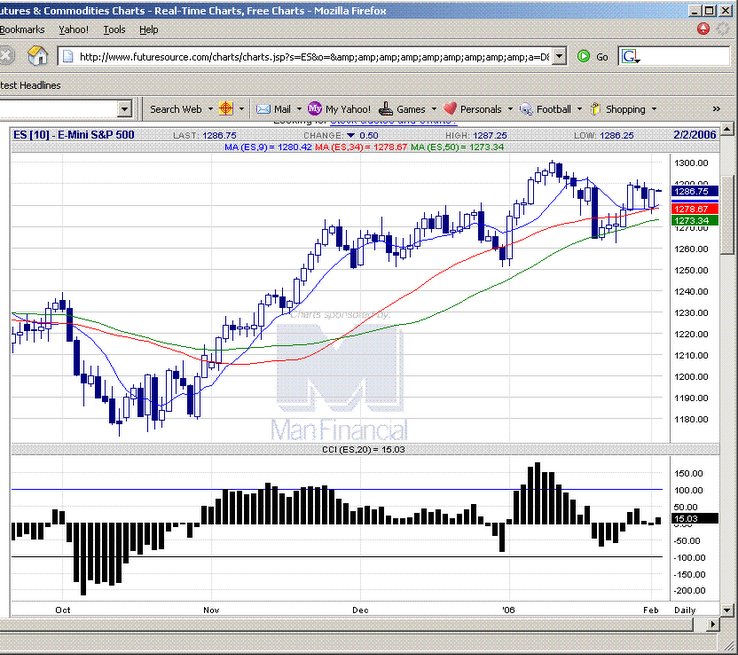
 20060202 Closes below key 1272 level and all moving average support. Candlestick pattern is also bearish. The small caps, the Russell 2000 also show some sign of technical weaknes, which would indicate ES has some downward bias and consolidation in the sessions ahead.
E-mini S&P 500 chart
20060202 Closes below key 1272 level and all moving average support. Candlestick pattern is also bearish. The small caps, the Russell 2000 also show some sign of technical weaknes, which would indicate ES has some downward bias and consolidation in the sessions ahead.
E-mini S&P 500 chart
posted by emacro @ 4:43 PM
0 comments
![]()
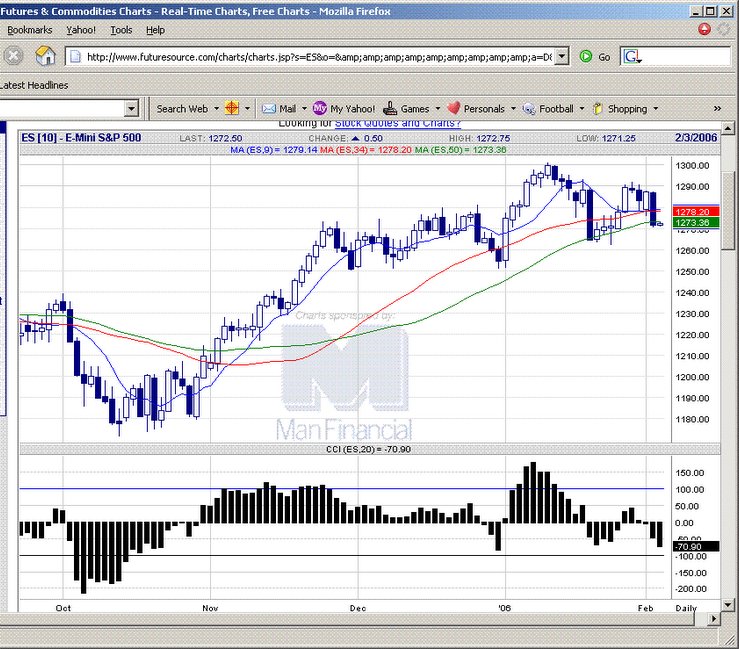
 20060201 1272 stil remains strong support. Price action seems to be consolidating sideways, with the small caps taking the lead up, judging from the stronger performance in the Russell 2000.
E-mini S&P 500 chart
20060201 1272 stil remains strong support. Price action seems to be consolidating sideways, with the small caps taking the lead up, judging from the stronger performance in the Russell 2000.
E-mini S&P 500 chart
posted by emacro @ 4:55 PM
0 comments
![]()
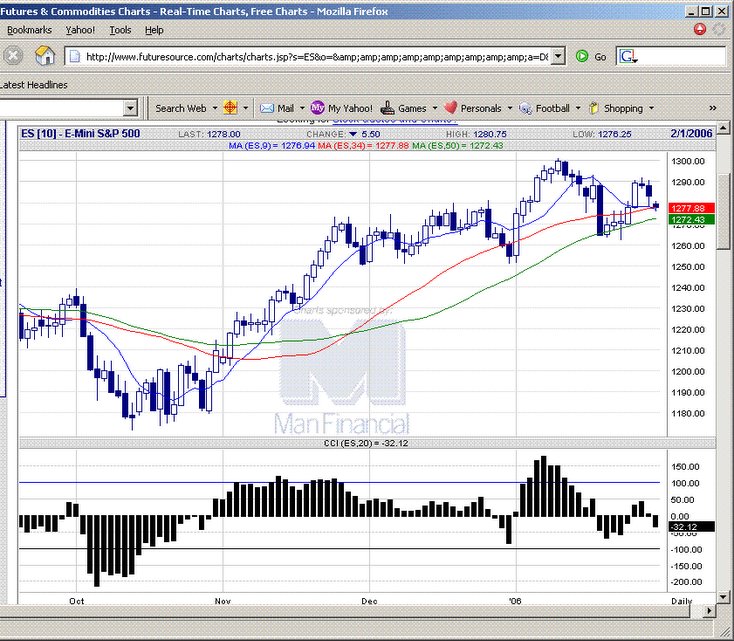 20060131 FOMC day. Might be teting the 1272 support level again, which could prove a good level to scalp long.
E-mini S&P 500 chart
20060131 FOMC day. Might be teting the 1272 support level again, which could prove a good level to scalp long.
E-mini S&P 500 chart
posted by emacro @ 1:40 AM
0 comments
![]()