posted by emacro @ 5:39 PM
0 comments
![]()
S&P 500 Charts
Chronicle of trading in ES S&P 500 index futures using momentum indicator CCI. Charts by www.futuresource.com. Note: The content here are for educational purposes only. Nothing in this blog constitute advice to buy or sell financial instruments and should not be construed as 'investment advice'.
Monday, July 31, 2006
Friday, July 28, 2006
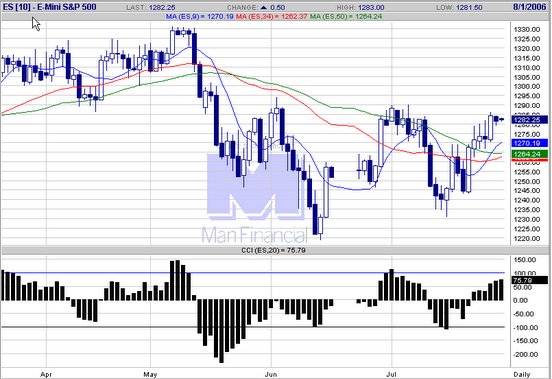
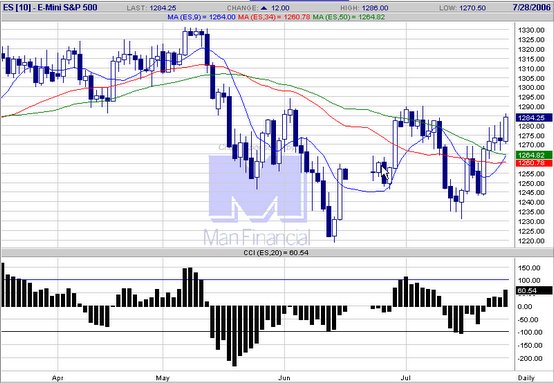 20060728 GDP weaker figures, pushes ES into the zone of the wicks. If we can get the close above 1285, might lead to further rally.
  E-mini S&P 500 chart
posted by emacro @ 8:26 PM
0 comments
![]()
Thursday, July 27, 2006
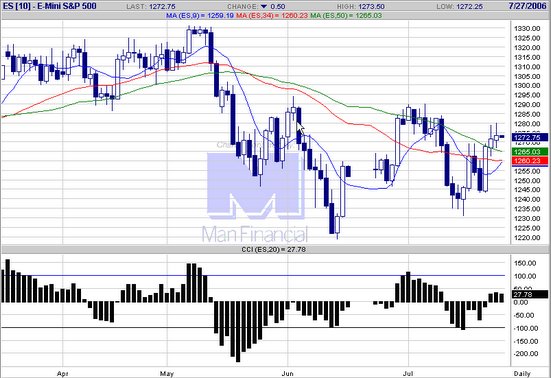
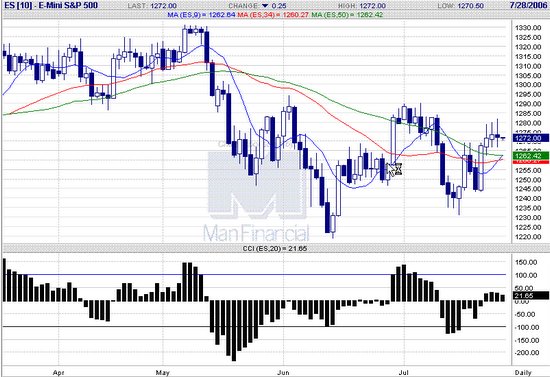 20060727 Long tailed candlesticks on ES indicates selling. Needs to break above 1285 convincingly to push higher.
E-mini S&P 500 chart
20060727 Long tailed candlesticks on ES indicates selling. Needs to break above 1285 convincingly to push higher.
E-mini S&P 500 chart
posted by emacro @ 9:03 PM
0 comments
![]()
Wednesday, July 26, 2006
posted by emacro @ 6:51 PM
0 comments
![]()
posted by emacro @ 6:49 PM
0 comments
![]()
Tuesday, July 25, 2006
posted by emacro @ 7:38 PM
0 comments
![]()
Monday, July 24, 2006
 20060724 Health care stocks rise due to better profit announcements, sparking rally on the ES.
E-mini S&P 500 chart
20060724 Health care stocks rise due to better profit announcements, sparking rally on the ES.
E-mini S&P 500 chart
posted by emacro @ 5:12 PM
0 comments
![]()
Friday, July 21, 2006
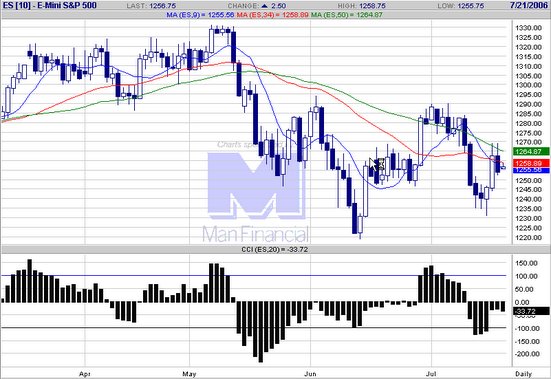
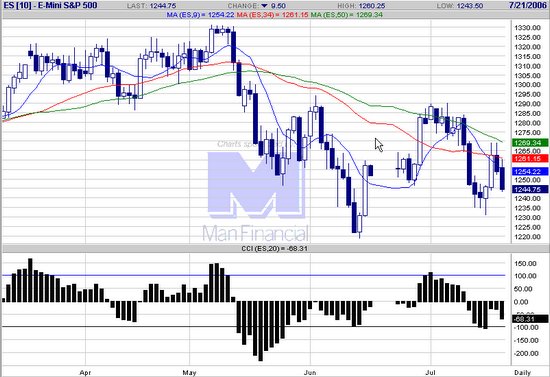 20060721 ES erases the gains made (after the Bernanke comments) Looks to have retraced 61.8%, possible to make continuation move up.
E-mini S&P 500 chart
20060721 ES erases the gains made (after the Bernanke comments) Looks to have retraced 61.8%, possible to make continuation move up.
E-mini S&P 500 chart
posted by emacro @ 7:50 PM
1 comments
![]()
Thursday, July 20, 2006
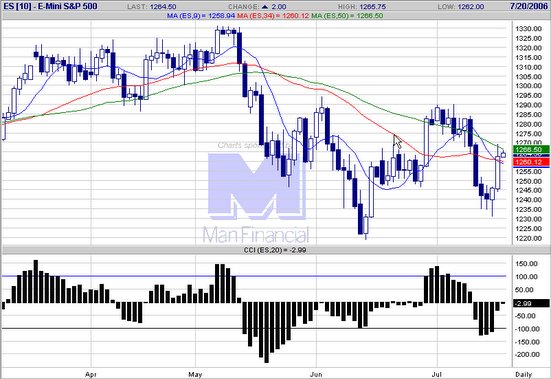
 20060720 ES retraces some of the big gains, turns out to be stronger than the big caps. CCI looks to be consolidating along zero line.
E-mini S&P 500 chart
20060720 ES retraces some of the big gains, turns out to be stronger than the big caps. CCI looks to be consolidating along zero line.
E-mini S&P 500 chart
posted by emacro @ 5:16 PM
0 comments
![]()
Wednesday, July 19, 2006
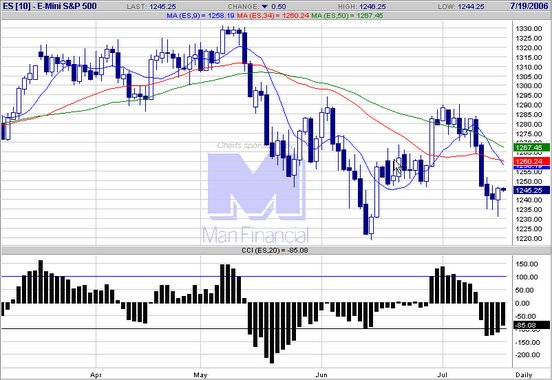
 20060719 Big rally to moving average resistance, on Bernanke 'elevator' comments.
E-mini S&P 500 chart
20060719 Big rally to moving average resistance, on Bernanke 'elevator' comments.
E-mini S&P 500 chart
posted by emacro @ 5:52 PM
0 comments
![]()
Tuesday, July 18, 2006
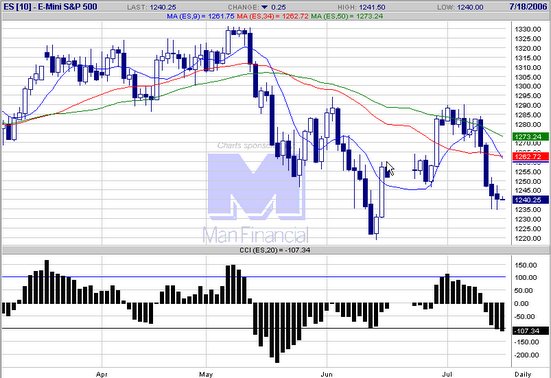
 20060718 To our expectations, the ES rebounds from intraday oversold conditions.
E-mini S&P 500 chart
20060718 To our expectations, the ES rebounds from intraday oversold conditions.
E-mini S&P 500 chart
posted by emacro @ 6:41 PM
0 comments
![]()
Monday, July 17, 2006
posted by emacro @ 5:28 PM
0 comments
![]()
Friday, July 14, 2006
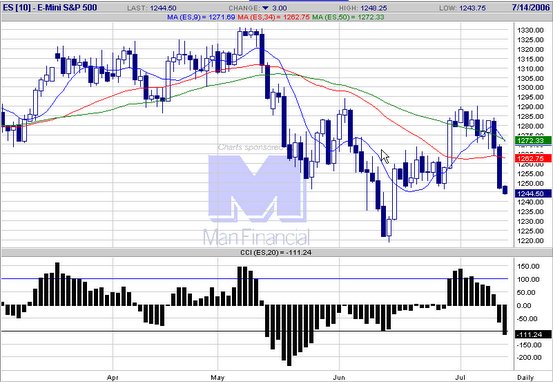
 20060714 With the CCI below zero, ES could be continuing on downward move, but expecting a technical rebound.
E-mini S&P 500 chart
20060714 With the CCI below zero, ES could be continuing on downward move, but expecting a technical rebound.
E-mini S&P 500 chart
posted by emacro @ 6:42 PM
0 comments
![]()
Thursday, July 13, 2006
 20060713 ES tumbles, momentum shift after the ZLR buy signal fails. Fears of escalation of conflict in the middle east cause crude oil to spike to US78 per barrel.
E-mini S&P 500 chart
20060713 ES tumbles, momentum shift after the ZLR buy signal fails. Fears of escalation of conflict in the middle east cause crude oil to spike to US78 per barrel.
E-mini S&P 500 chart
posted by emacro @ 6:14 PM
0 comments
![]()
 20060713 ES momentum shift reversal, after failure of zLR buy signal. Middle east conflict widens by Israel spark fear of escalation, with crude oil spiking to US78 per barrel.
E-mini S&P 500 chart
20060713 ES momentum shift reversal, after failure of zLR buy signal. Middle east conflict widens by Israel spark fear of escalation, with crude oil spiking to US78 per barrel.
E-mini S&P 500 chart
posted by emacro @ 6:13 PM
0 comments
![]()
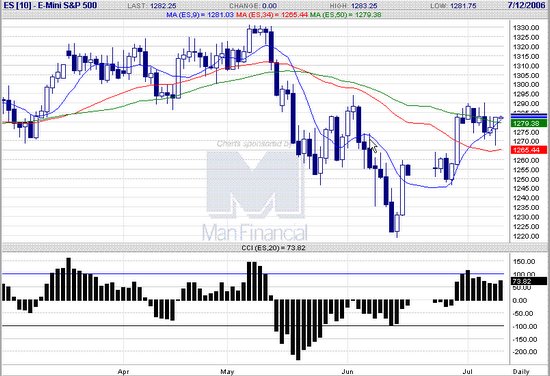
Wednesday, July 12, 2006

posted by emacro @ 5:52 PM
0 comments
![]()
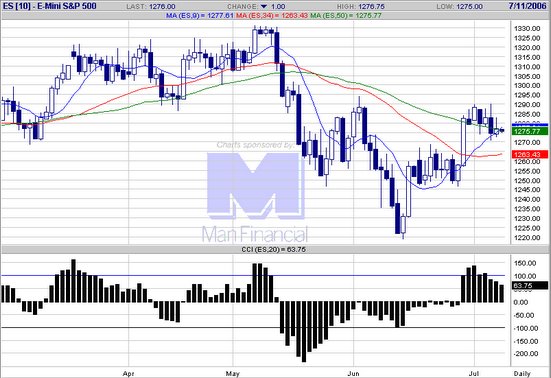
Tuesday, July 11, 2006
posted by emacro @ 5:13 PM
0 comments
![]()
Monday, July 10, 2006
posted by emacro @ 6:56 PM
0 comments
![]()
Friday, July 07, 2006

posted by emacro @ 6:26 PM
0 comments
![]()
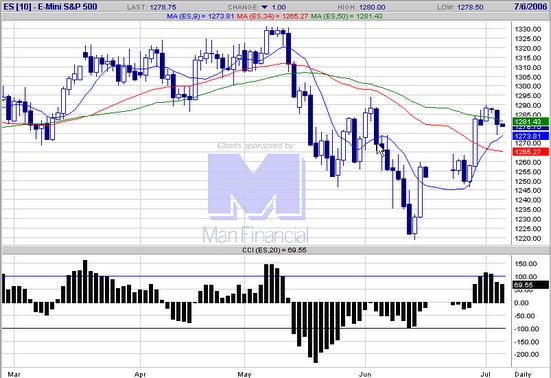
Thursday, July 06, 2006

posted by emacro @ 7:19 PM
0 comments
![]()
Wednesday, July 05, 2006
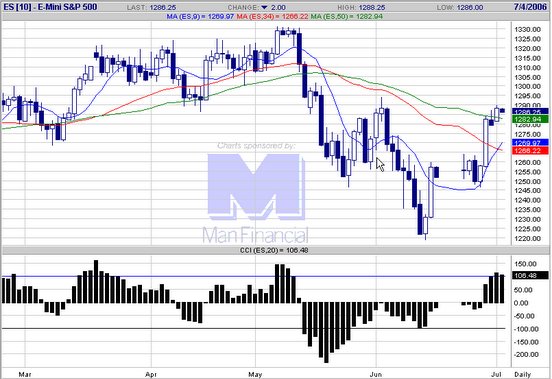
 20060705 North Kores test fired 7 missiles today. ES price action shows an evening star reversal pattern, along with CCI punching below +100, indicates a sell signal.
E-mini S&P 500 chart
20060705 North Kores test fired 7 missiles today. ES price action shows an evening star reversal pattern, along with CCI punching below +100, indicates a sell signal.
E-mini S&P 500 chart
posted by emacro @ 6:38 PM
0 comments
![]()
Monday, July 03, 2006
posted by emacro @ 7:22 PM
0 comments
![]()
Sponsors
- 20110525 ES futures 2 min Wolfe wave reaches the o...
- 2011054 A wolfe wave long on ES futures after the ...
- 20110517 A amall 5 min EUR futures wolfe wave, a s...
- 20110517 ES futures, wofe wave long i globex.
- 20110516 Halfway move on Soybean futures, and a de...
- 20110516 ES
- 20110516 ES futures 5 min, woldfe wave in globex s...
- 20110513 ES futures sell on wolfe wave 5 min.
- 5 min ES
- 20110512 July Soybean sutures....5 min.
- June 2005
- July 2005
- August 2005
- September 2005
- October 2005
- November 2005
- December 2005
- January 2006
- February 2006
- March 2006
- April 2006
- May 2006
- June 2006
- July 2006
- August 2006
- September 2006
- October 2006
- November 2006
- December 2006
- January 2007
- February 2007
- March 2007
- April 2007
- May 2007
- June 2007
- July 2007
- August 2007
- September 2007
- October 2007
- November 2007
- June 2008
- August 2008
- September 2008
- October 2008
- November 2008
- December 2008
- March 2009
- March 2010
- May 2010
- July 2010
- August 2010
- September 2010
- October 2010
- March 2011
- April 2011
- May 2011
- Current Posts
Links
Previous Posts
Archives

Syndicate this site


