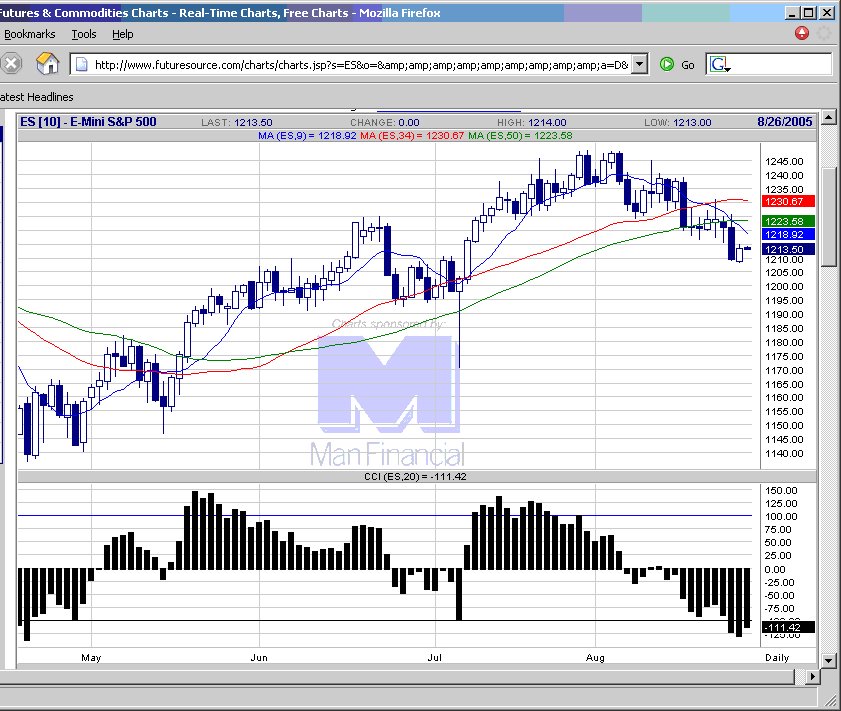
20050830 The expected strength in the morning did not eventuate, with the ES gapping down. An ID pattern today, indicating possibility of either side breakout.
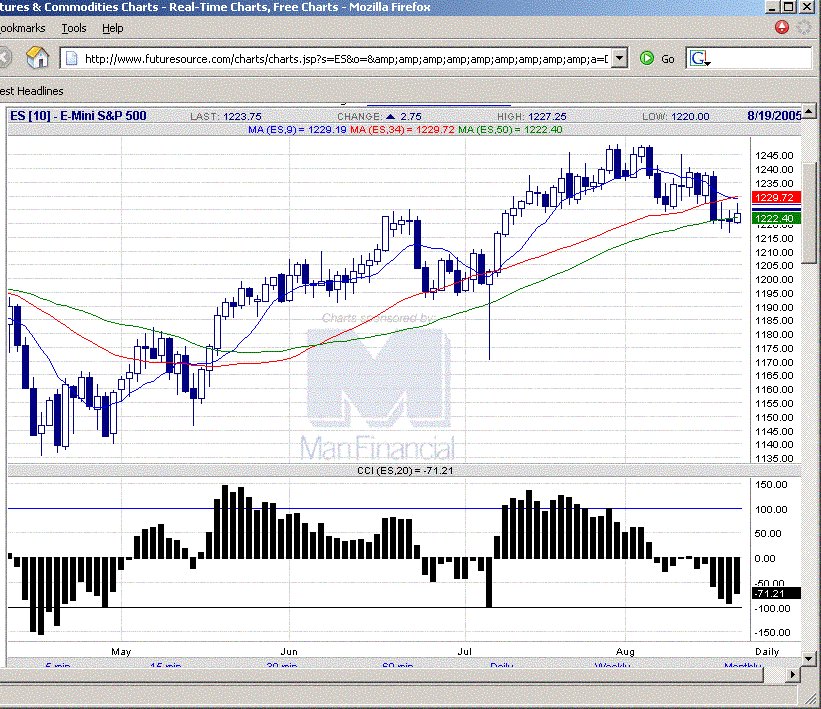
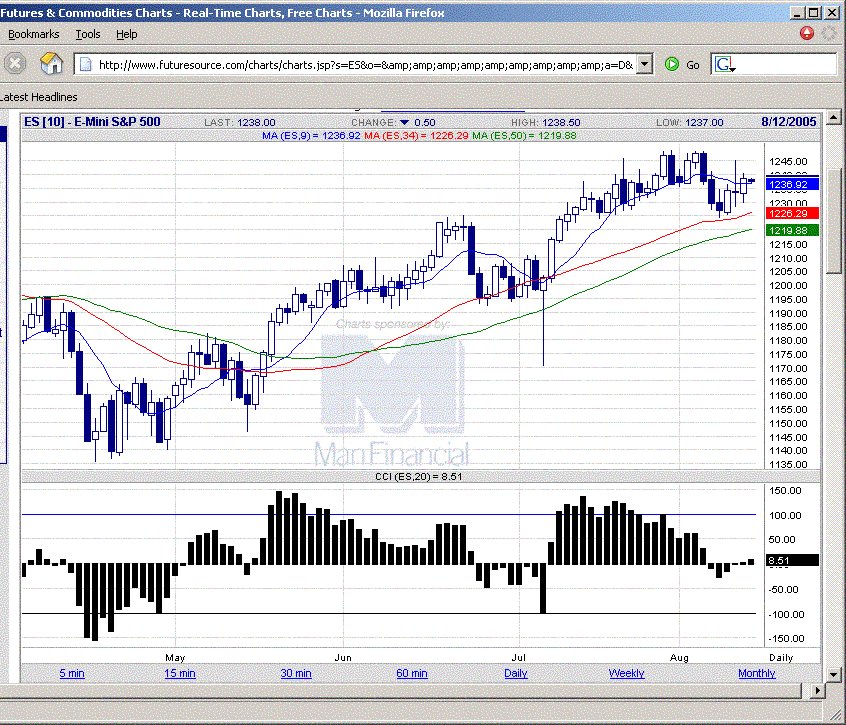
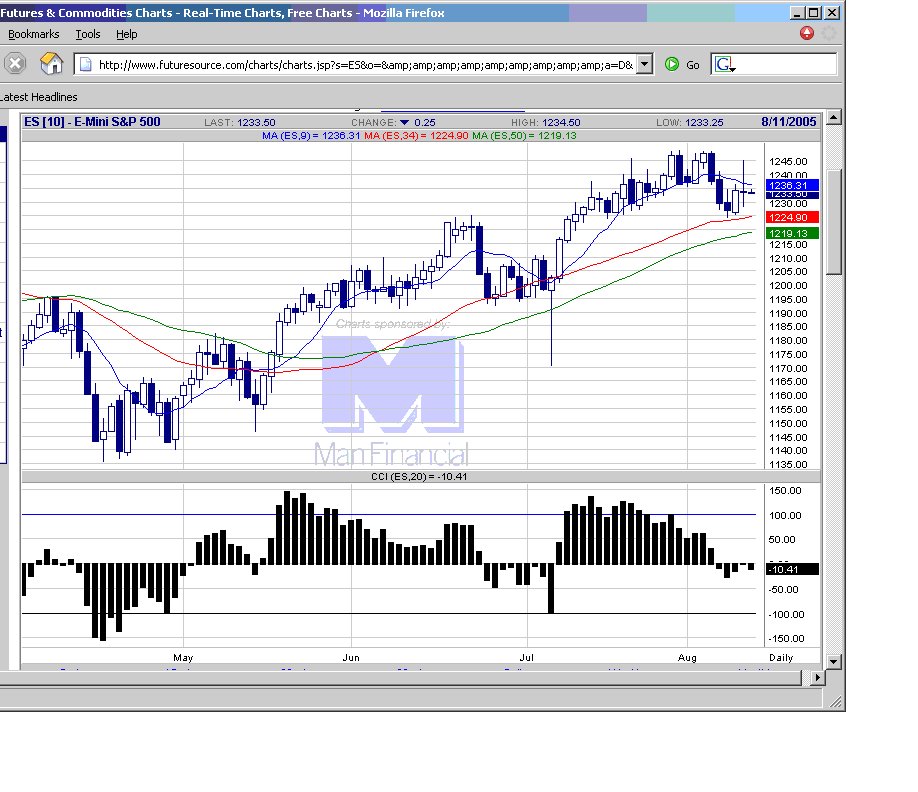
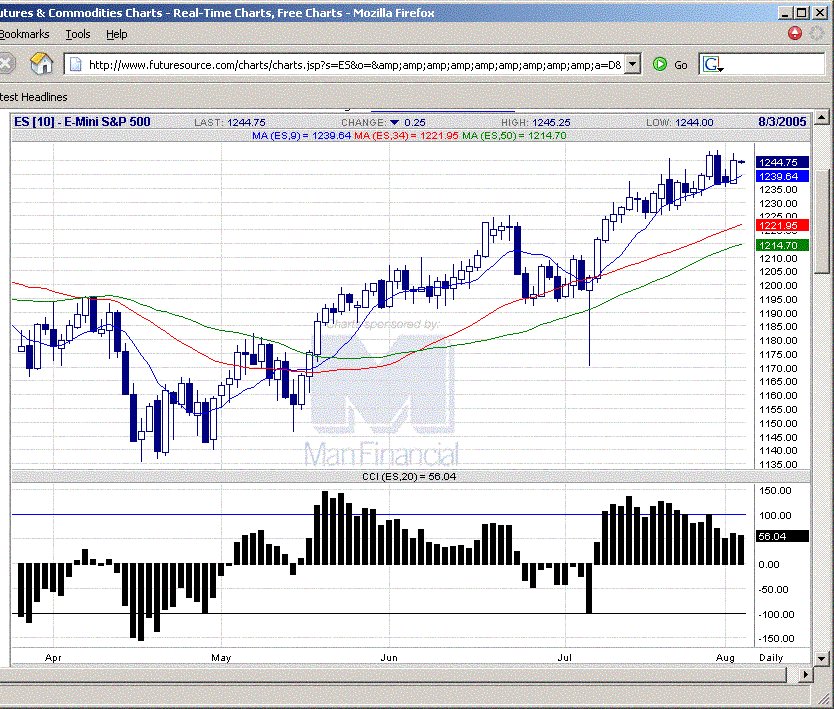
 E-mini S&P 500 chart
posted by emacro @ 6:32 PM
0 comments
![]()