 20061024 ES dominant candle 2 days ago, indicate sellers in control. Might look fo rshorts below the lows of that candlestick.
  E-mini S&P 500 chart
posted by emacro @ 8:49 PM
0 comments
![]()
Chronicle of trading in ES S&P 500 index futures using momentum indicator CCI. Charts by www.futuresource.com. Note: The content here are for educational purposes only. Nothing in this blog constitute advice to buy or sell financial instruments and should not be construed as 'investment advice'.
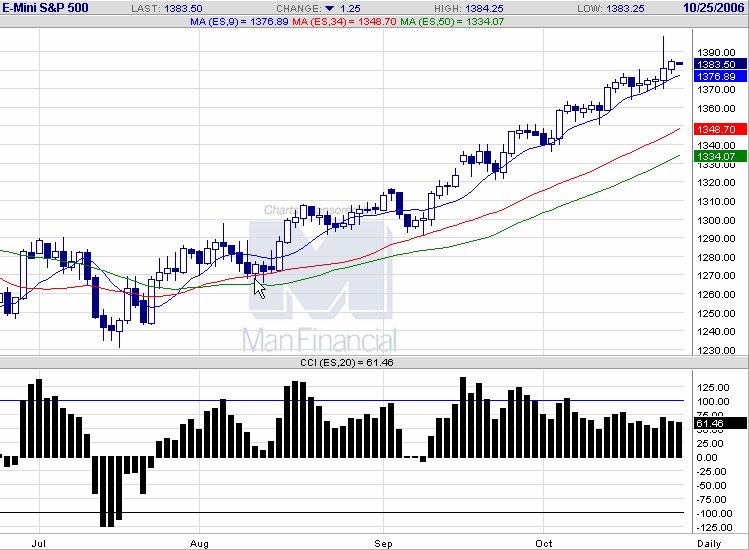
20061024 ES dominant candle 2 days ago, indicate sellers in control. Might look fo rshorts below the lows of that candlestick.
E-mini S&P 500 chart
posted by emacro @ 8:49 PM
0 comments
![]()


0 Comments:
Post a Comment
<< Home