20050729 A bearish candlestick pattern, showing selling. Expect urther downside from here, but ES is resting on moving average support.

 E-mini S&P 500 chart
posted by emacro @ 7:35 PM
1 comments
![]()
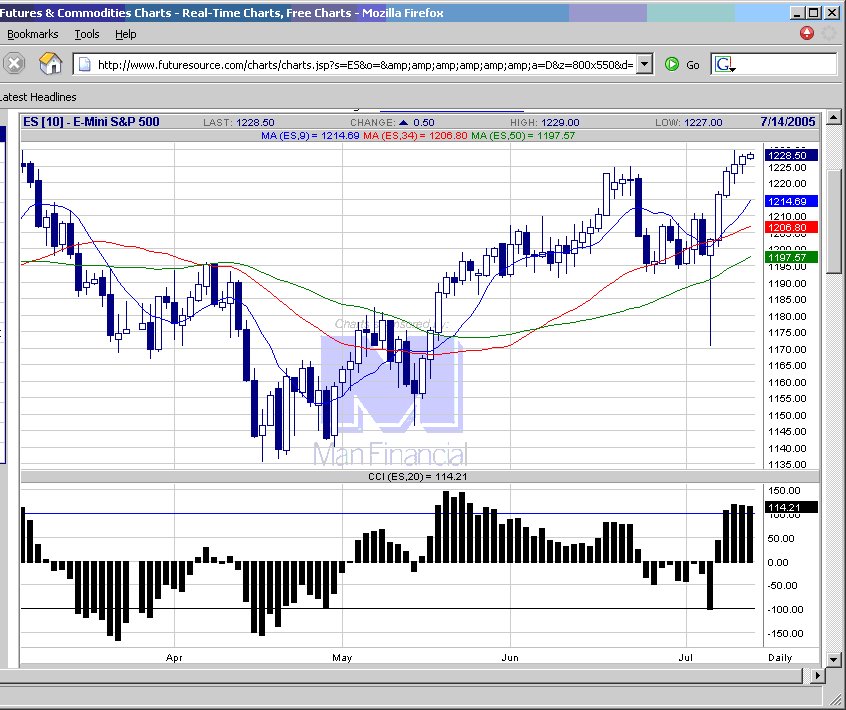
Chronicle of trading in ES S&P 500 index futures using momentum indicator CCI. Charts by www.futuresource.com. Note: The content here are for educational purposes only. Nothing in this blog constitute advice to buy or sell financial instruments and should not be construed as 'investment advice'.
20050729 A bearish candlestick pattern, showing selling. Expect urther downside from here, but ES is resting on moving average support.
E-mini S&P 500 chart
posted by emacro @ 7:35 PM
1 comments
![]()
20050728 2nd day of continuatin of the break out of the ID/NR4. Headlines says "S&P and Nasdaq climb to 4 year highs"
 E-mini S&P 500 chart
posted by emacro @ 5:12 PM
0 comments
![]()
posted by emacro @ 7:42 PM
0 comments
![]()
20050726 An ID/NR4 inside day/narrowest range last 4 days setup for breakout either side.
 E-mini S&P 500 chart
posted by emacro @ 6:02 PM
0 comments
![]()
posted by emacro @ 11:03 PM
0 comments
![]()
posted by emacro @ 7:53 PM
0 comments
![]()
20050721 Daily candlestick is or selling interest overwhelming buyers. Expect more weakness at least on open today.
 E-mini S&P 500 chart
posted by emacro @ 2:44 AM
0 comments
![]()
posted by emacro @ 5:10 PM
0 comments
![]()
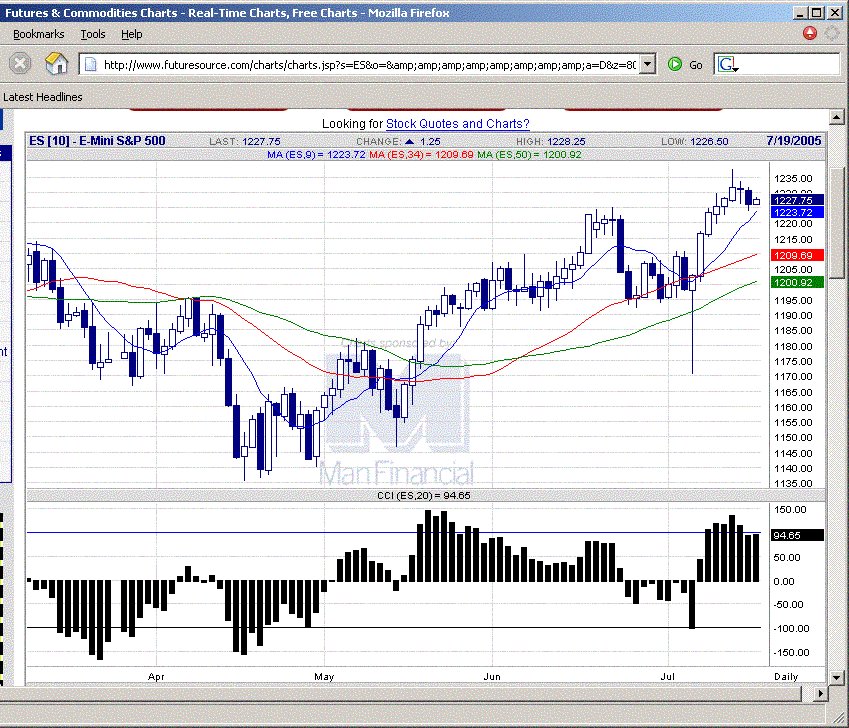
20050719 Buying interest seen in the candlestick. CCI back above +100, a +100 rejection is a buy signal but is aggressive, with the risk being higher than a ZLR.
 E-mini S&P 500 chart
posted by emacro @ 1:00 AM
0 comments
![]()
20050718 CCI closed below +100, a sell signal, coupled with the selling candlestick, so the move down could have begun. Needs CCI to get back above +100.
 E-mini S&P 500 chart
posted by emacro @ 4:53 PM
0 comments
![]()
 E-mini S&P 500 chart
posted by emacro @ 8:17 PM
0 comments
![]()
 E-mini S&P 500 chart
posted by emacro @ 3:51 PM
0 comments
![]()
posted by emacro @ 6:05 PM
0 comments
![]()
 E-mini S&P 500 chart
posted by emacro @ 6:13 PM
0 comments
![]()
 E-mini S&P 500 chart
posted by emacro @ 2:41 AM
0 comments
![]()
 E-mini S&P 500 chart
posted by emacro @ 7:20 PM
0 comments
![]()
 E-mini S&P 500 chart
posted by emacro @ 4:14 PM
0 comments
![]()
 E-mini S&P 500 chart
posted by emacro @ 5:18 PM
0 comments
![]()