posted by emacro @ 5:50 PM
0 comments
![]()
S&P 500 Charts
Chronicle of trading in ES S&P 500 index futures using momentum indicator CCI. Charts by www.futuresource.com. Note: The content here are for educational purposes only. Nothing in this blog constitute advice to buy or sell financial instruments and should not be construed as 'investment advice'.
Friday, April 28, 2006
Thursday, April 27, 2006
posted by emacro @ 4:40 PM
0 comments
![]()
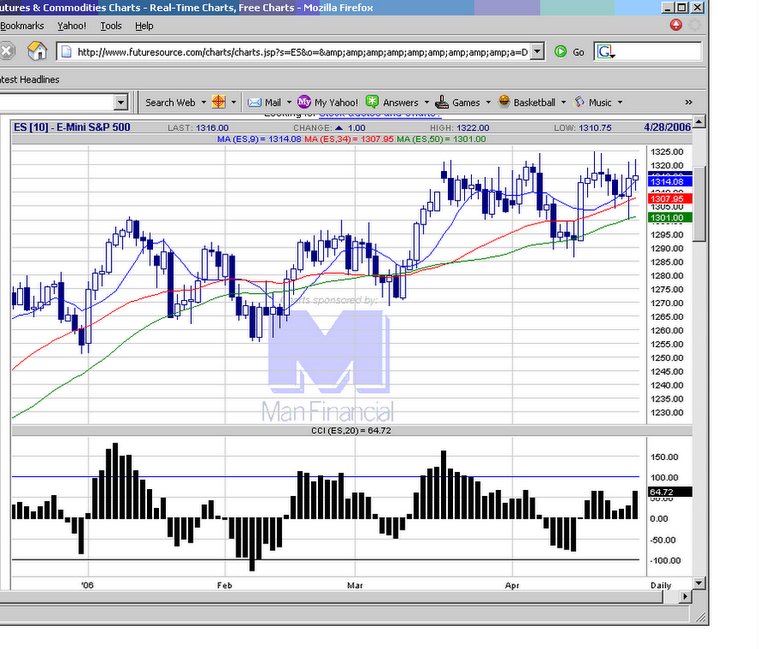
 20060427 ES needs to hold above 1310 to maintain the upside momentum of the current move.
  E-mini S&P 500 chart
posted by emacro @ 4:38 PM
0 comments
![]()
Monday, April 24, 2006
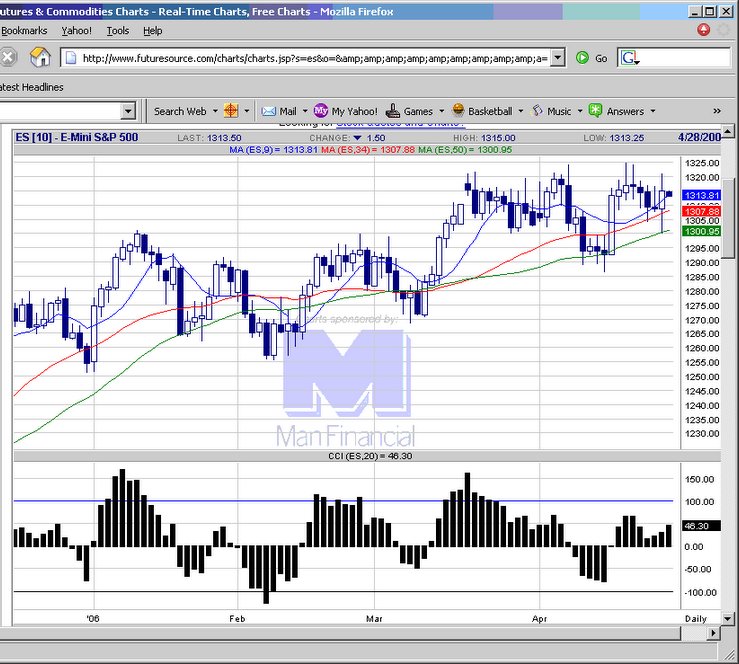
 20060424 ES long wicks on the candlesticks indicate markets are still uncertain on direction, with doomsday merchants harping on US75 oil.
E-mini S&P 500 chart
20060424 ES long wicks on the candlesticks indicate markets are still uncertain on direction, with doomsday merchants harping on US75 oil.
E-mini S&P 500 chart
posted by emacro @ 5:38 PM
0 comments
![]()
Friday, April 21, 2006
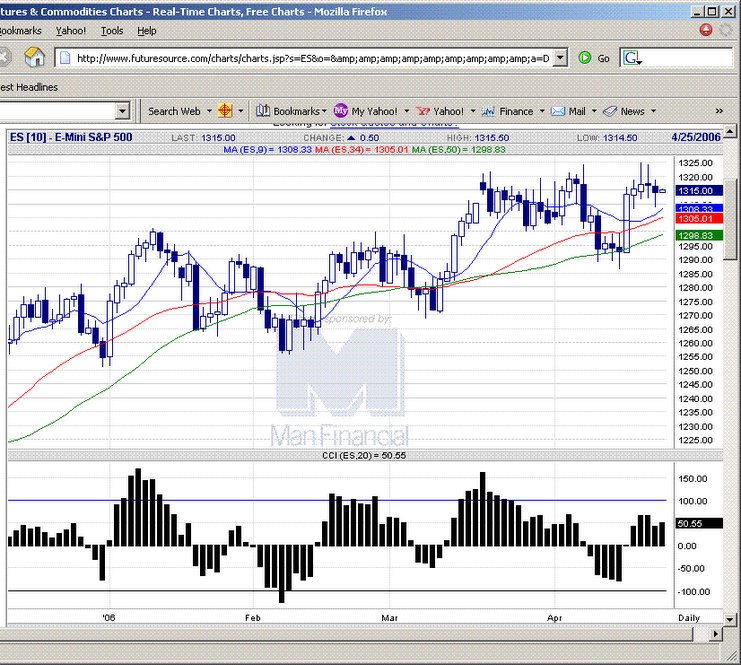
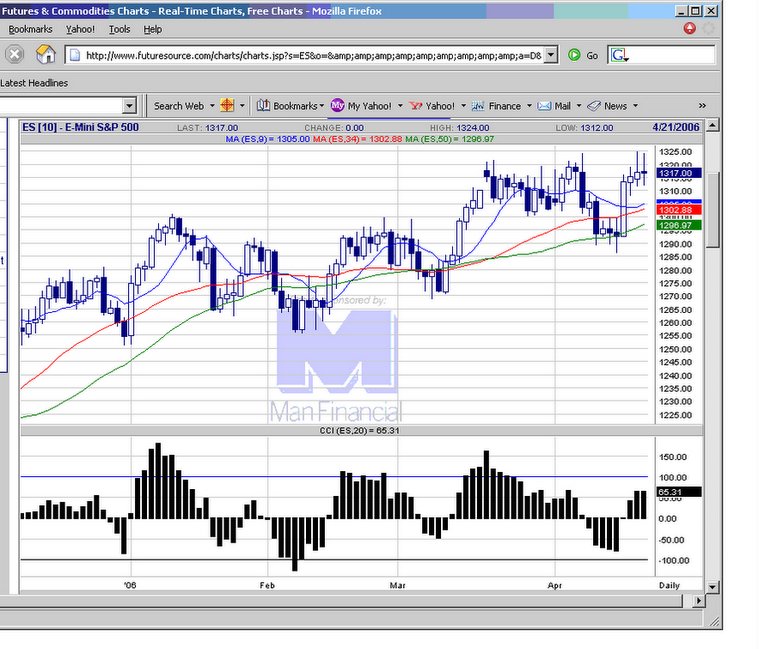 20060421 Big doji on the ES, indicates uncertainty due to the oil price hitting above US75 per barrel.
E-mini S&P 500 chart
20060421 Big doji on the ES, indicates uncertainty due to the oil price hitting above US75 per barrel.
E-mini S&P 500 chart
posted by emacro @ 6:05 PM
0 comments
![]()
Thursday, April 20, 2006
 20060420 S&P 500 shows some resilience, despite the strong gains of late, mild profit taking. Dow breaches 10400, but closes below.
E-mini S&P 500 chart
20060420 S&P 500 shows some resilience, despite the strong gains of late, mild profit taking. Dow breaches 10400, but closes below.
E-mini S&P 500 chart
posted by emacro @ 7:25 PM
0 comments
![]()
Wednesday, April 19, 2006
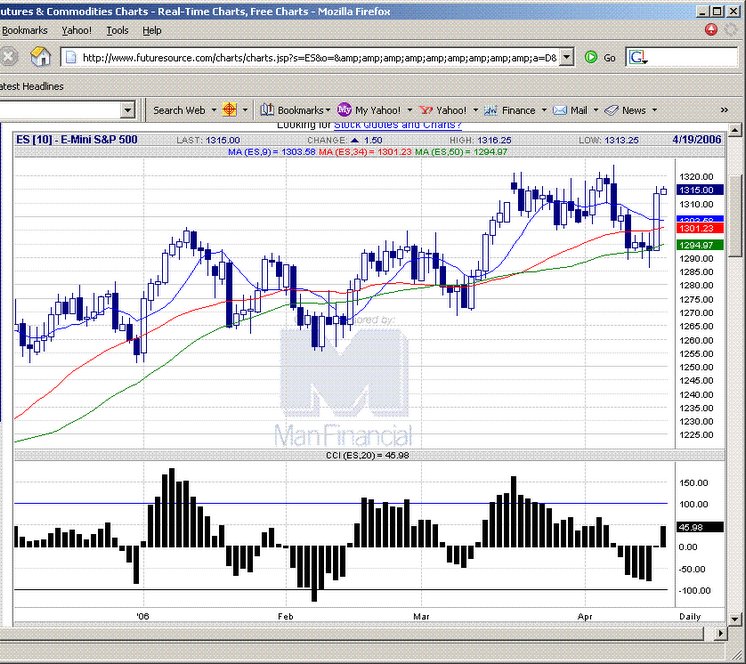
 20060419 The day fter 425 of the 500 S&P500 stocks rose. Continued momentum pushed into higher ground, holding the 1309 support. Oil price above USD72 per barrel was ignored.
E-mini S&P 500 chart
20060419 The day fter 425 of the 500 S&P500 stocks rose. Continued momentum pushed into higher ground, holding the 1309 support. Oil price above USD72 per barrel was ignored.
E-mini S&P 500 chart
posted by emacro @ 8:20 PM
0 comments
![]()
Tuesday, April 18, 2006
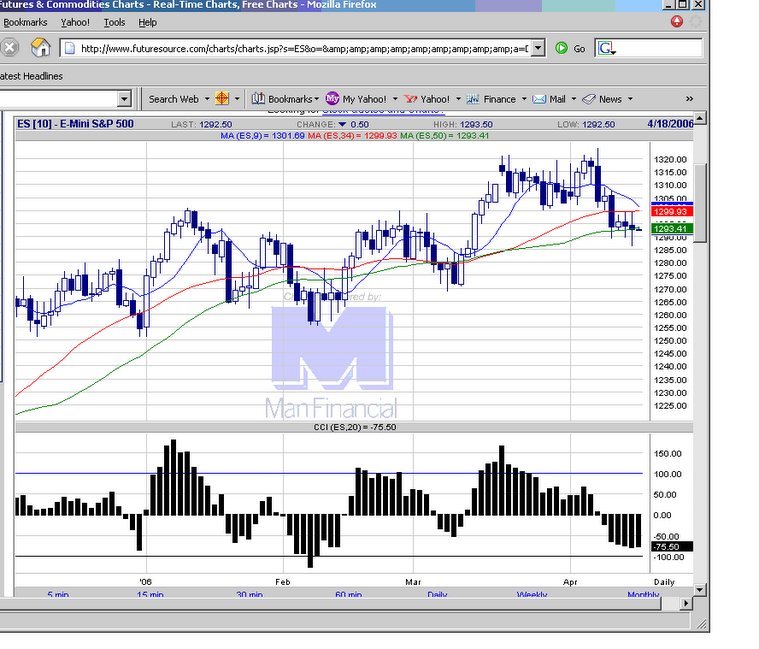
 20060418 Breaks through resistance at 1309 (previous support), looking t buy dips.
E-mini S&P 500 chart
20060418 Breaks through resistance at 1309 (previous support), looking t buy dips.
E-mini S&P 500 chart
posted by emacro @ 9:22 PM
0 comments
![]()
Monday, April 17, 2006
posted by emacro @ 5:38 PM
0 comments
![]()
Thursday, April 13, 2006
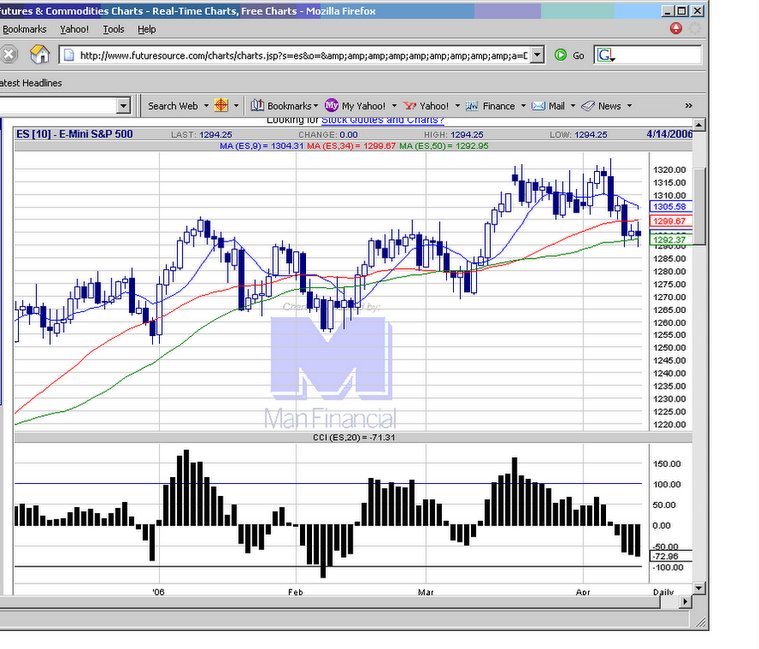 20060314 ES remains below the 1309, since the break of that suport identified last week. Needs to get above that to negate possible downside.
E-mini S&P 500 chart
20060314 ES remains below the 1309, since the break of that suport identified last week. Needs to get above that to negate possible downside.
E-mini S&P 500 chart
posted by emacro @ 6:06 PM
0 comments
![]()
Tuesday, April 11, 2006
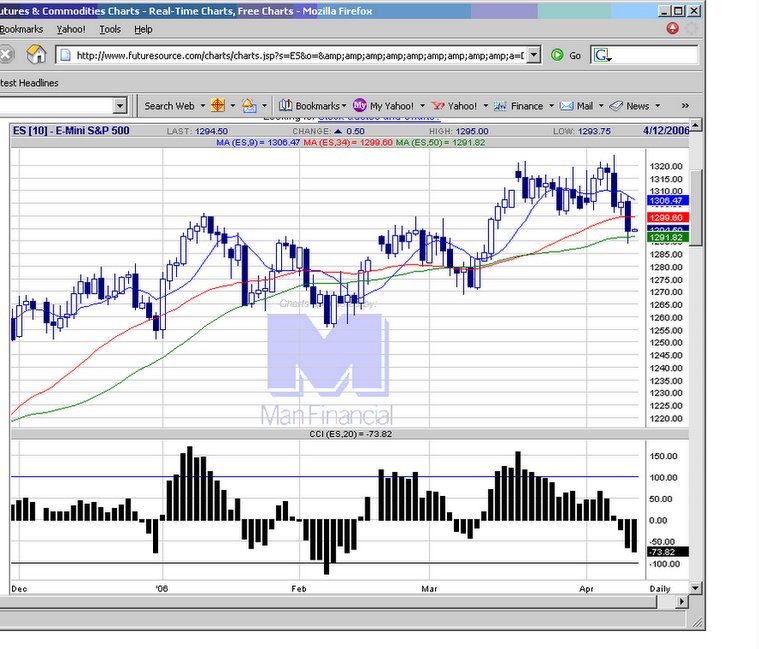 20060411 cci fals below zero, support at 1309 broke. Looking for shorts on pullback to mov avg.
E-mini S&P 500 chart
20060411 cci fals below zero, support at 1309 broke. Looking for shorts on pullback to mov avg.
E-mini S&P 500 chart
posted by emacro @ 5:15 PM
0 comments
![]()
Monday, April 10, 2006
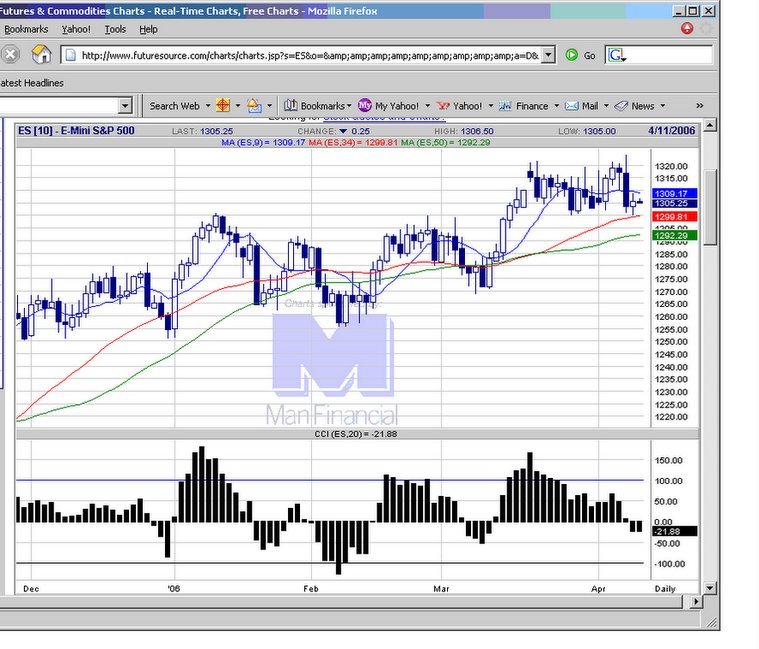 20060410 A pause in the downward movement, possibly continuing once 1399 is taken out.
E-mini S&P 500 chart
20060410 A pause in the downward movement, possibly continuing once 1399 is taken out.
E-mini S&P 500 chart
posted by emacro @ 5:46 PM
0 comments
![]()
Saturday, April 08, 2006
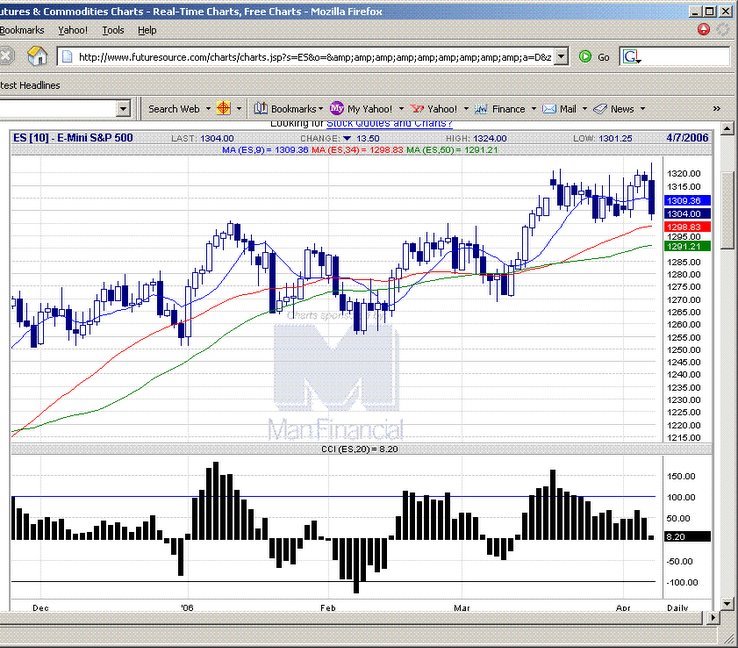 20060407 Looks to be pretty strong momentum building to punch through the bottom of 1300-20 range. If it does can present opportunity to short the first pullback.
E-mini S&P 500 chart
20060407 Looks to be pretty strong momentum building to punch through the bottom of 1300-20 range. If it does can present opportunity to short the first pullback.
E-mini S&P 500 chart
posted by emacro @ 12:05 AM
0 comments
![]()
Thursday, April 06, 2006
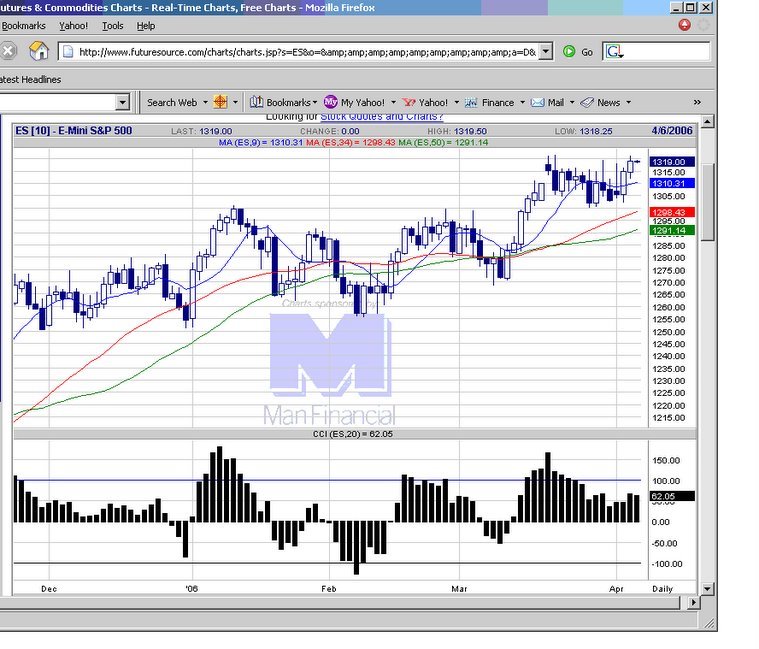
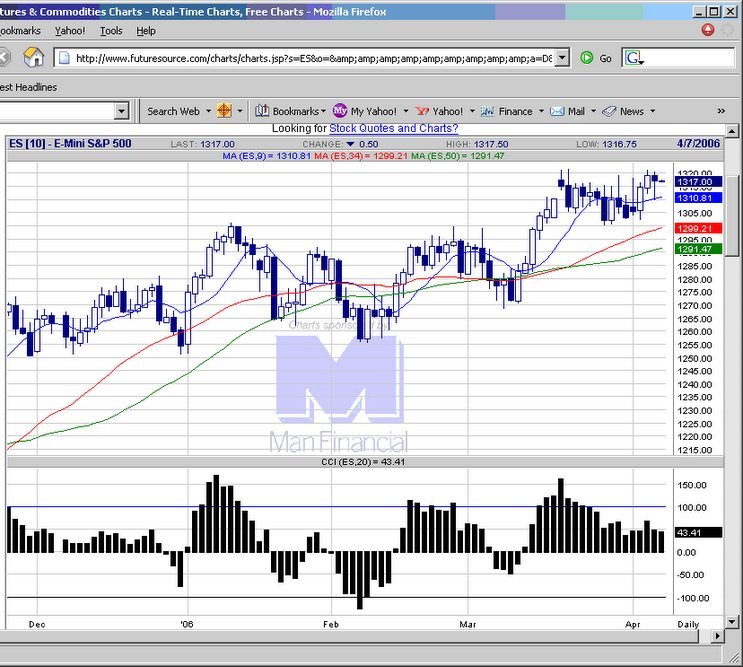 20060406 Did not make the assault on the 1320 level as expected, but buyers still stepped in to stem the early selling pressure.
E-mini S&P 500 chart
20060406 Did not make the assault on the 1320 level as expected, but buyers still stepped in to stem the early selling pressure.
E-mini S&P 500 chart
posted by emacro @ 5:08 PM
0 comments
![]()
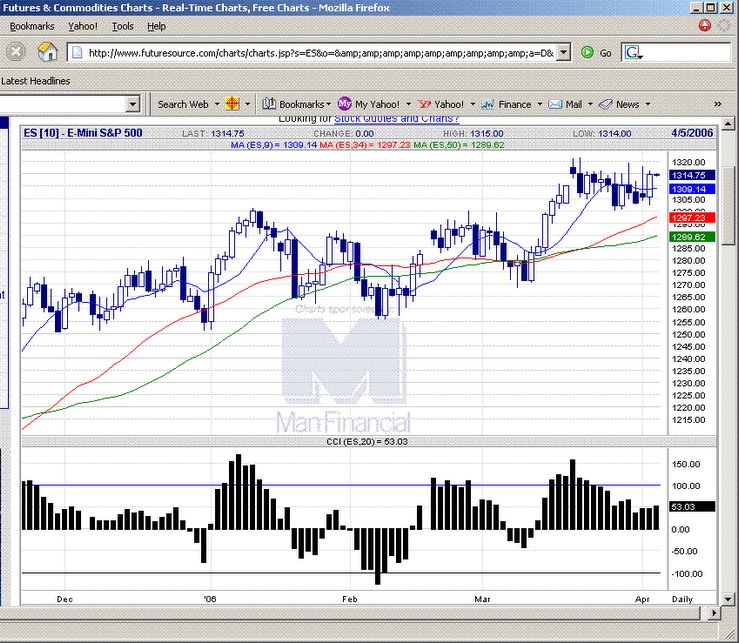
 20060405 Testing the top of the 1300-1320 range, a break above can see some distance to travel up.
E-mini S&P 500 chart
20060405 Testing the top of the 1300-1320 range, a break above can see some distance to travel up.
E-mini S&P 500 chart
posted by emacro @ 12:31 AM
0 comments
![]()
Tuesday, April 04, 2006
 20060404 ES needs to breakout of the recent 1300-1320 range for significant movement
E-mini S&P 500 chart
20060404 ES needs to breakout of the recent 1300-1320 range for significant movement
E-mini S&P 500 chart
posted by emacro @ 4:50 PM
0 comments
![]()
Monday, April 03, 2006
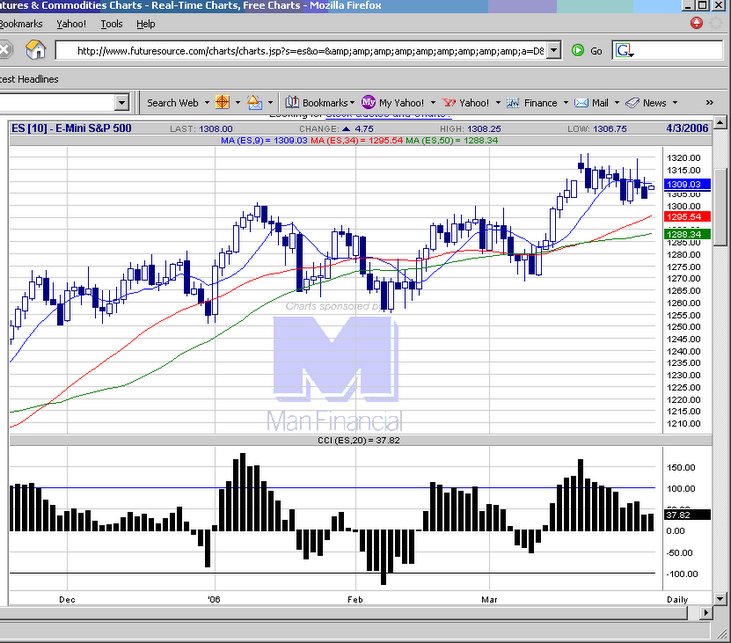
 20060403 Resistance faced at 1315-1318, from the wicks of the candles. Bigger picture is within the 1300-20 level consolidation.
E-mini S&P 500 chart
20060403 Resistance faced at 1315-1318, from the wicks of the candles. Bigger picture is within the 1300-20 level consolidation.
E-mini S&P 500 chart
posted by emacro @ 5:20 PM
0 comments
![]()
Sunday, April 02, 2006
 20060331 ES is trading sideways consolidation in 1300-1320 range. Needs to break out either side to see significant moves.
E-mini S&P 500 chart
20060331 ES is trading sideways consolidation in 1300-1320 range. Needs to break out either side to see significant moves.
E-mini S&P 500 chart
posted by emacro @ 6:42 PM
0 comments
![]()
Sponsors
- 20110525 ES futures 2 min Wolfe wave reaches the o...
- 2011054 A wolfe wave long on ES futures after the ...
- 20110517 A amall 5 min EUR futures wolfe wave, a s...
- 20110517 ES futures, wofe wave long i globex.
- 20110516 Halfway move on Soybean futures, and a de...
- 20110516 ES
- 20110516 ES futures 5 min, woldfe wave in globex s...
- 20110513 ES futures sell on wolfe wave 5 min.
- 5 min ES
- 20110512 July Soybean sutures....5 min.
- June 2005
- July 2005
- August 2005
- September 2005
- October 2005
- November 2005
- December 2005
- January 2006
- February 2006
- March 2006
- April 2006
- May 2006
- June 2006
- July 2006
- August 2006
- September 2006
- October 2006
- November 2006
- December 2006
- January 2007
- February 2007
- March 2007
- April 2007
- May 2007
- June 2007
- July 2007
- August 2007
- September 2007
- October 2007
- November 2007
- June 2008
- August 2008
- September 2008
- October 2008
- November 2008
- December 2008
- March 2009
- March 2010
- May 2010
- July 2010
- August 2010
- September 2010
- October 2010
- March 2011
- April 2011
- May 2011
- Current Posts
Links
Previous Posts
Archives

Syndicate this site


