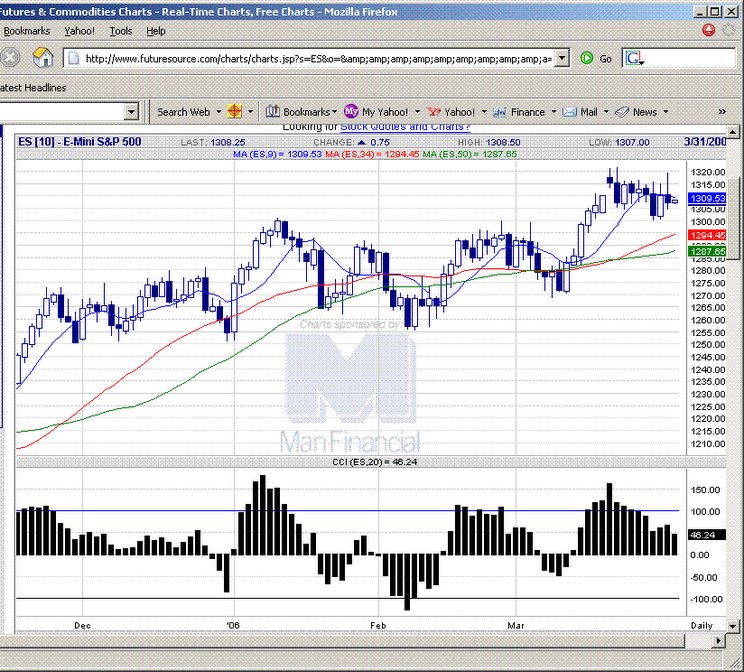
 20060330 ES candle today is inverted hammer, but the trading looks like forming a bull flag range
  E-mini S&P 500 chart
posted by emacro @ 4:34 PM
0 comments
![]()
Chronicle of trading in ES S&P 500 index futures using momentum indicator CCI. Charts by www.futuresource.com. Note: The content here are for educational purposes only. Nothing in this blog constitute advice to buy or sell financial instruments and should not be construed as 'investment advice'.
20060330 ES candle today is inverted hammer, but the trading looks like forming a bull flag range
E-mini S&P 500 chart
posted by emacro @ 4:34 PM
0 comments
![]()
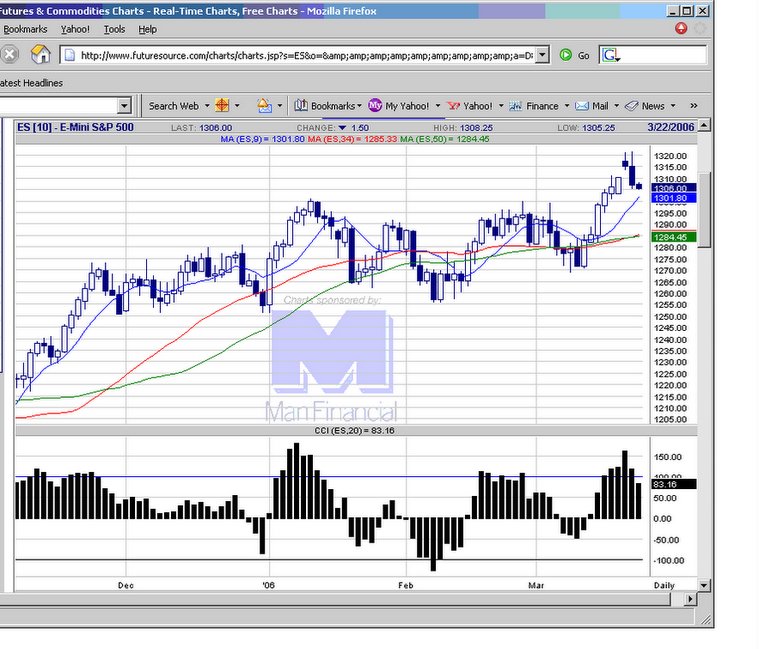
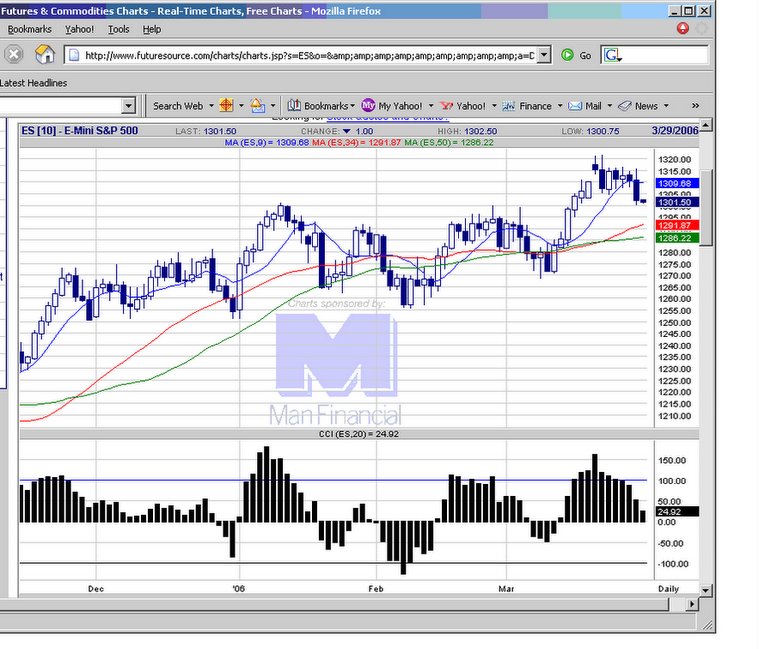 20060328 FOMC interest rate decision day, first with B Bernanke as chairman. Bearish reversal candlestick, and ES closes below the key 1305 level.
E-mini S&P 500 chart
20060328 FOMC interest rate decision day, first with B Bernanke as chairman. Bearish reversal candlestick, and ES closes below the key 1305 level.
E-mini S&P 500 chart
posted by emacro @ 4:23 PM
0 comments
![]()
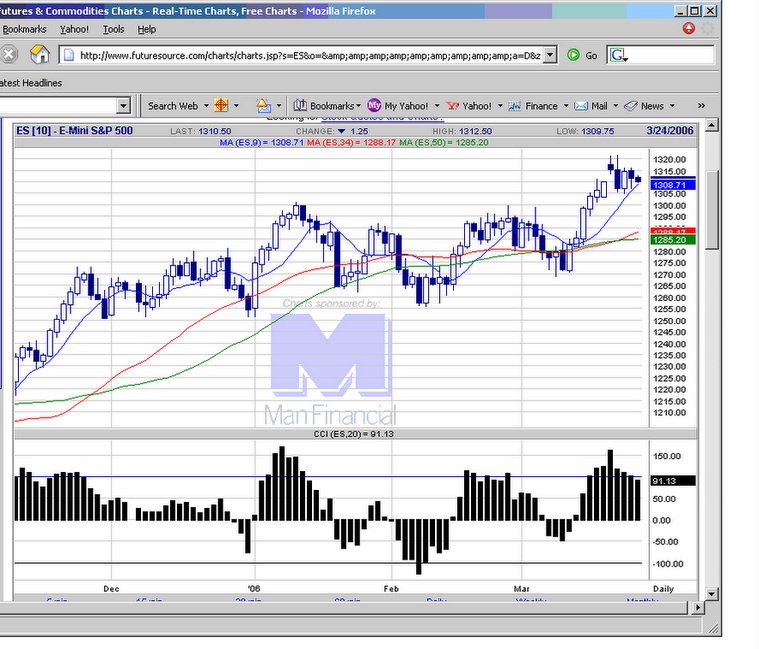
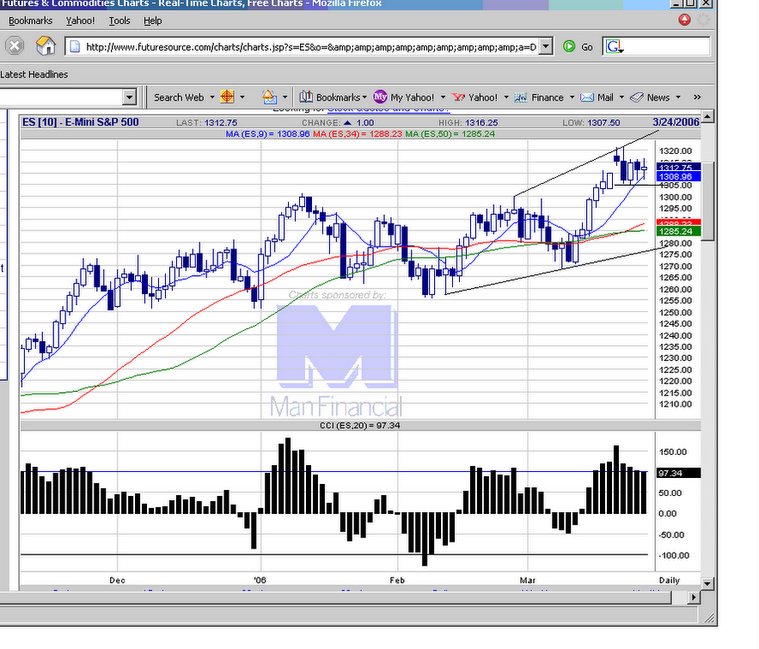 20060324 Some suppot and resistance trendlines, 1305 remains key to uptrend continuing
E-mini S&P 500 chart
20060324 Some suppot and resistance trendlines, 1305 remains key to uptrend continuing
E-mini S&P 500 chart
posted by emacro @ 6:44 PM
0 comments
![]()
posted by emacro @ 4:11 PM
0 comments
![]()
posted by emacro @ 4:10 PM
0 comments
![]()
posted by emacro @ 4:58 PM
0 comments
![]()
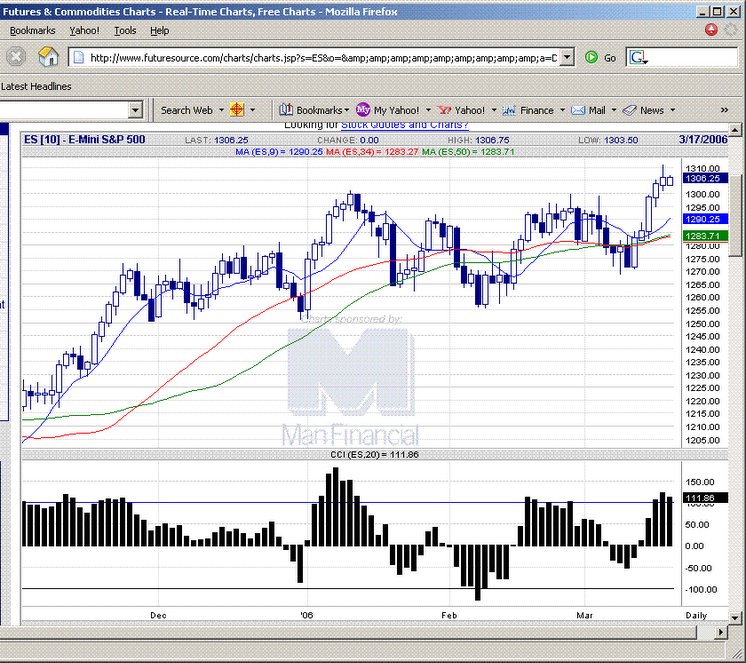
 20060317 Since the breakout of the 1260-1290 range, target would be 1320, the width of the old consolidation. We might scribe a new range from here.
E-mini S&P 500 chart
20060317 Since the breakout of the 1260-1290 range, target would be 1320, the width of the old consolidation. We might scribe a new range from here.
E-mini S&P 500 chart
posted by emacro @ 6:53 PM
0 comments
![]()
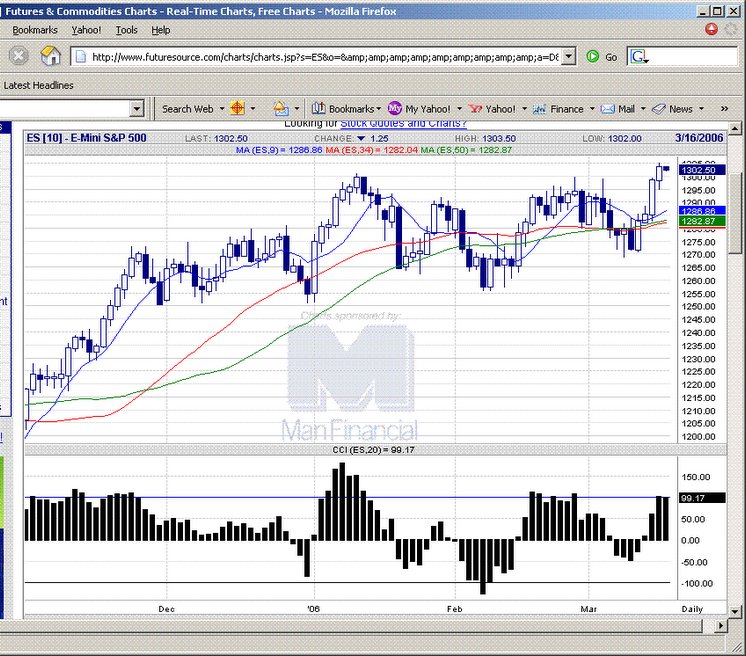
 20060316 S&P 500 futures, no indications of uptrend failing yet, nor any reversal signals short term.
E-mini S&P 500 chart
20060316 S&P 500 futures, no indications of uptrend failing yet, nor any reversal signals short term.
E-mini S&P 500 chart
posted by emacro @ 5:05 PM
0 comments
![]()
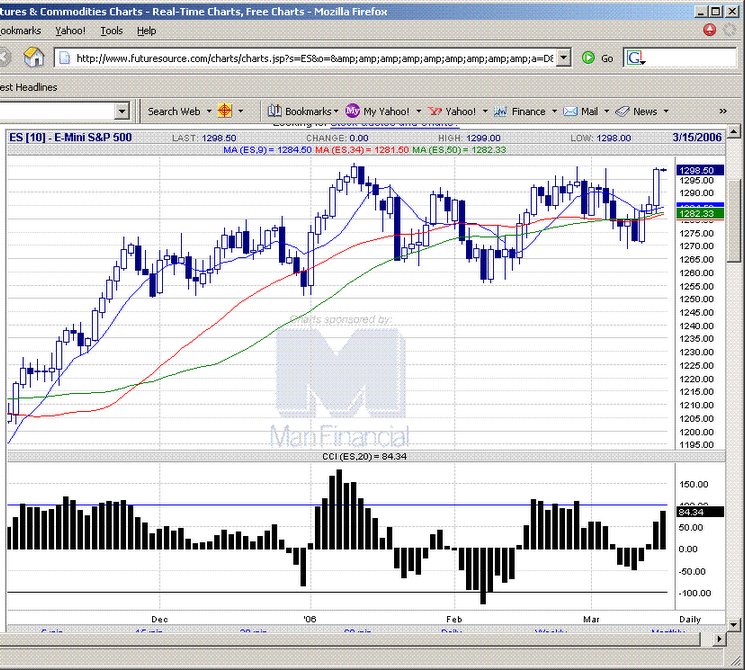
 20060315 Continues on to make new high for the ES. Might be a turte soup reversal short setting up.
E-mini S&P 500 chart
20060315 Continues on to make new high for the ES. Might be a turte soup reversal short setting up.
E-mini S&P 500 chart
posted by emacro @ 4:24 PM
0 comments
![]()
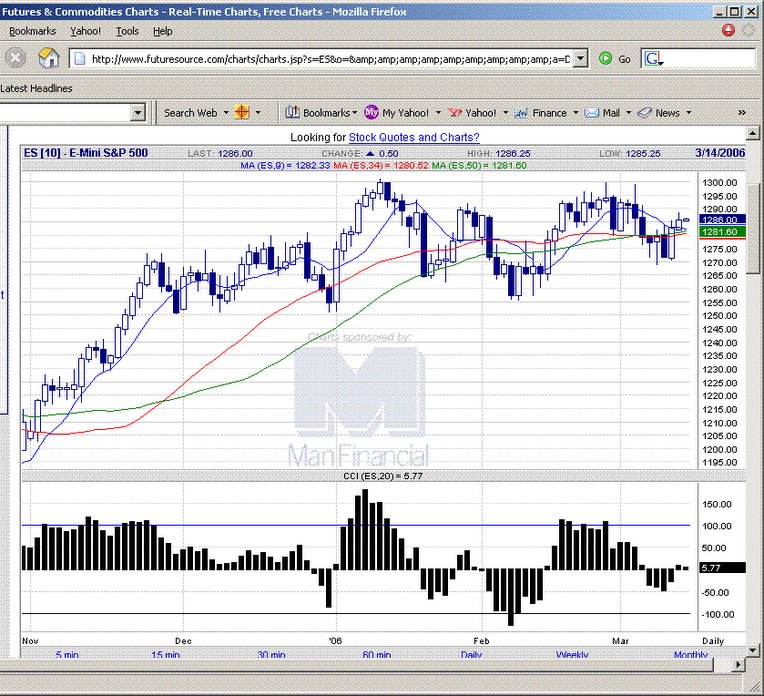
 20060314 ES strong buying candlestick on day the cash S&P reaches highest level since 2001. Goldman Sach strong profit numbers lifts market.
E-mini S&P 500 chart
20060314 ES strong buying candlestick on day the cash S&P reaches highest level since 2001. Goldman Sach strong profit numbers lifts market.
E-mini S&P 500 chart
posted by emacro @ 4:14 PM
0 comments
![]()
 20060313 Above the moving aerages, with a positive candlestick indicating buying interest, with CCI peeking above zero line, indications are for continued upside.
E-mini S&P 500 chart
20060313 Above the moving aerages, with a positive candlestick indicating buying interest, with CCI peeking above zero line, indications are for continued upside.
E-mini S&P 500 chart
posted by emacro @ 4:12 PM
0 comments
![]()
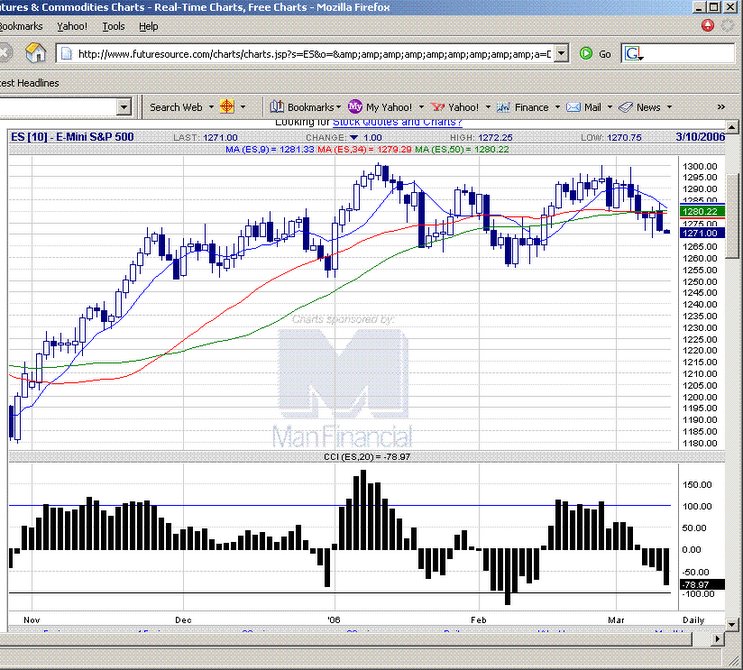
 20060310 Engulfing bullish candlestock on NFP data day. Should continue strength into early part of next week.
E-mini S&P 500 chart
20060310 Engulfing bullish candlestock on NFP data day. Should continue strength into early part of next week.
E-mini S&P 500 chart
posted by emacro @ 5:46 PM
0 comments
![]()
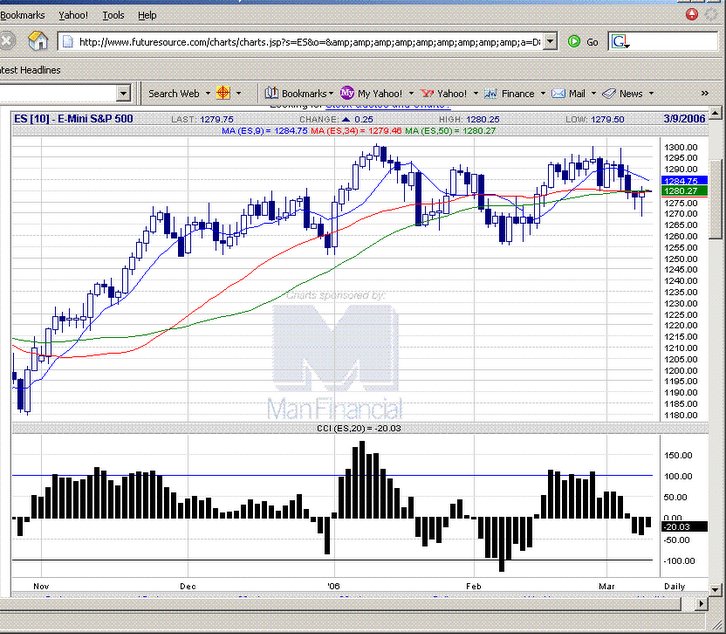
 20060309 Follow through buying created the expected strength in the morning, but ES is unable to sustain gains, closing low. This is not a sign of a strong upside market. NFT tomorrow will maybe shed more light.
E-mini S&P 500 chart
20060309 Follow through buying created the expected strength in the morning, but ES is unable to sustain gains, closing low. This is not a sign of a strong upside market. NFT tomorrow will maybe shed more light.
E-mini S&P 500 chart
posted by emacro @ 6:07 PM
0 comments
![]()
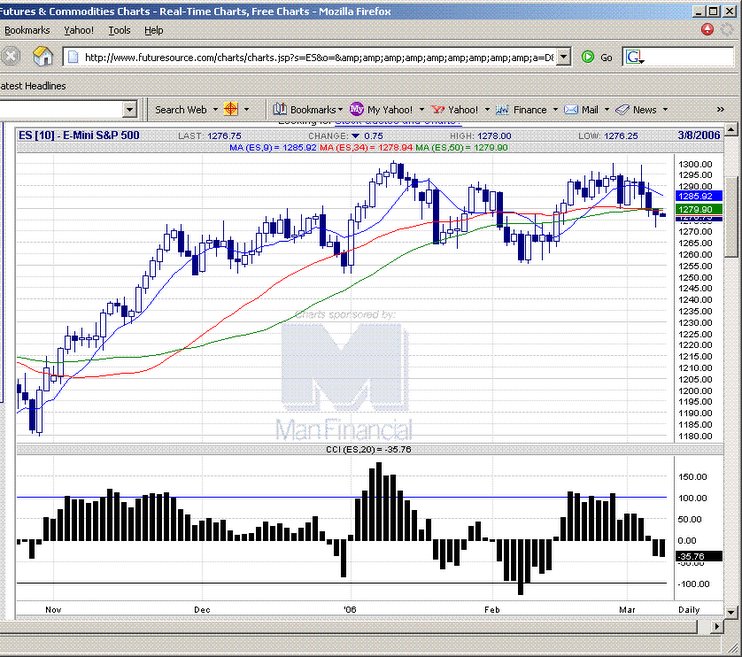
 20060308 Possible short term reversal with hammer candlestick. Look for strength, at least into the morning of 9 March.
E-mini S&P 500 chart
20060308 Possible short term reversal with hammer candlestick. Look for strength, at least into the morning of 9 March.
E-mini S&P 500 chart
posted by emacro @ 3:46 PM
0 comments
![]()
posted by emacro @ 3:57 PM
0 comments
![]()
posted by emacro @ 6:03 PM
0 comments
![]()
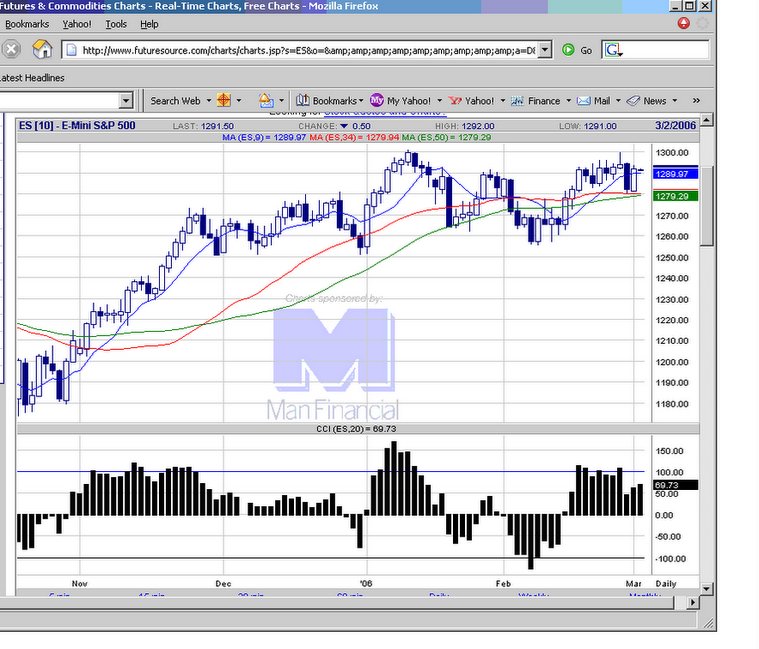
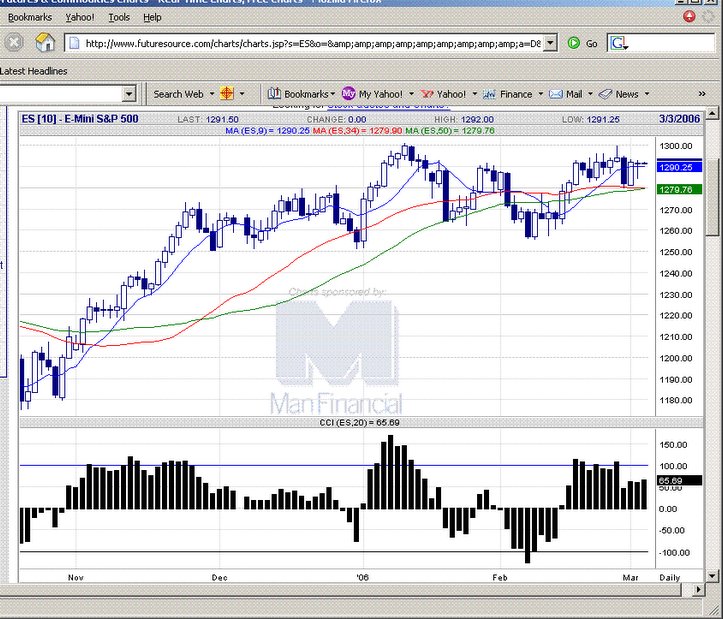 20060302 Inside Day doji with a long shadow, indicates bulls still in control, with morning weakness being profit taking.
E-mini S&P 500 chart
20060302 Inside Day doji with a long shadow, indicates bulls still in control, with morning weakness being profit taking.
E-mini S&P 500 chart
posted by emacro @ 4:45 PM
0 comments
![]()
posted by emacro @ 4:03 PM
0 comments
![]()