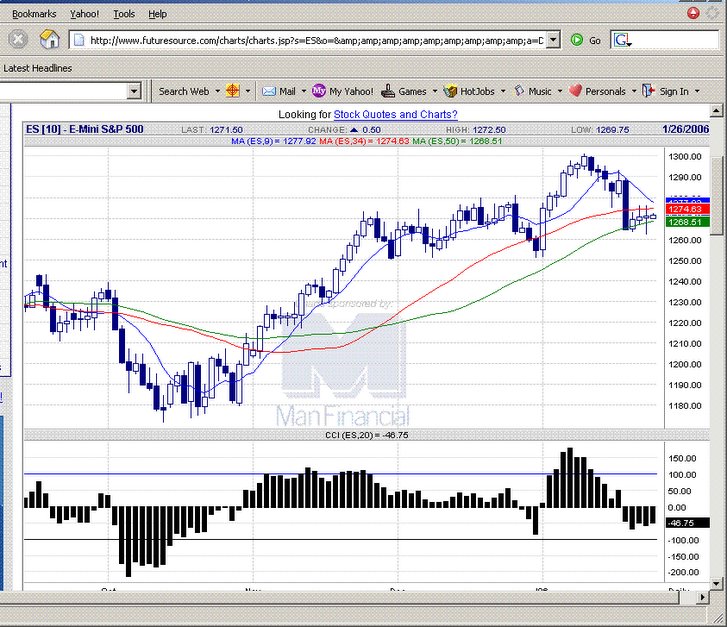
20060126 Nice move up today, stopping the price action and ma crossovers that would have confirmed the continuation of the bear flag.
  E-mini S&P 500 chart
posted by emacro @ 4:52 PM
0 comments
![]()
Chronicle of trading in ES S&P 500 index futures using momentum indicator CCI. Charts by www.futuresource.com. Note: The content here are for educational purposes only. Nothing in this blog constitute advice to buy or sell financial instruments and should not be construed as 'investment advice'.
20060126 Nice move up today, stopping the price action and ma crossovers that would have confirmed the continuation of the bear flag.
E-mini S&P 500 chart
posted by emacro @ 4:52 PM
0 comments
![]()
posted by emacro @ 3:54 PM
0 comments
![]()
Some historical statistics on the S&P 500 performance in past years
posted by emacro @ 6:01 PM
0 comments
![]()
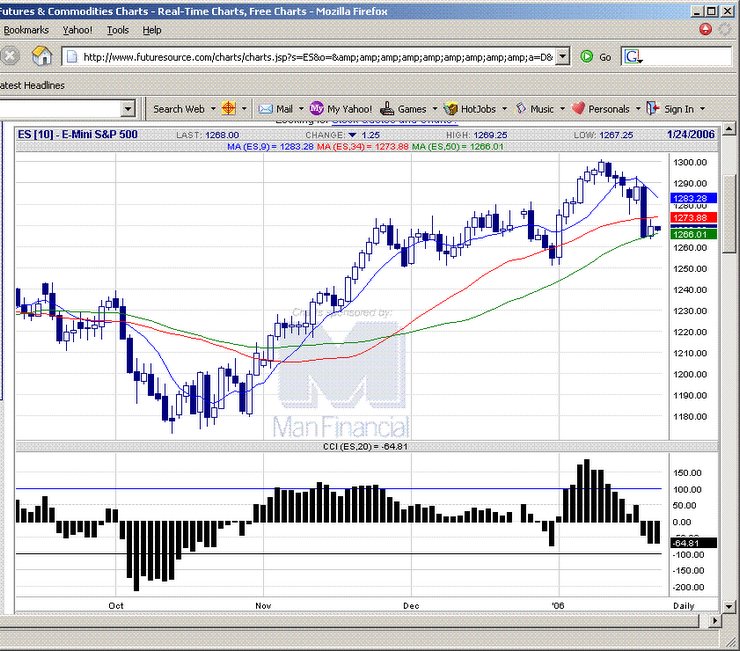
 20060124 Rangebound trade. Daily candlesticks look like orming a bear flag, will have to keep an eye on this.
E-mini S&P 500 chart
20060124 Rangebound trade. Daily candlesticks look like orming a bear flag, will have to keep an eye on this.
E-mini S&P 500 chart
posted by emacro @ 4:30 PM
0 comments
![]()
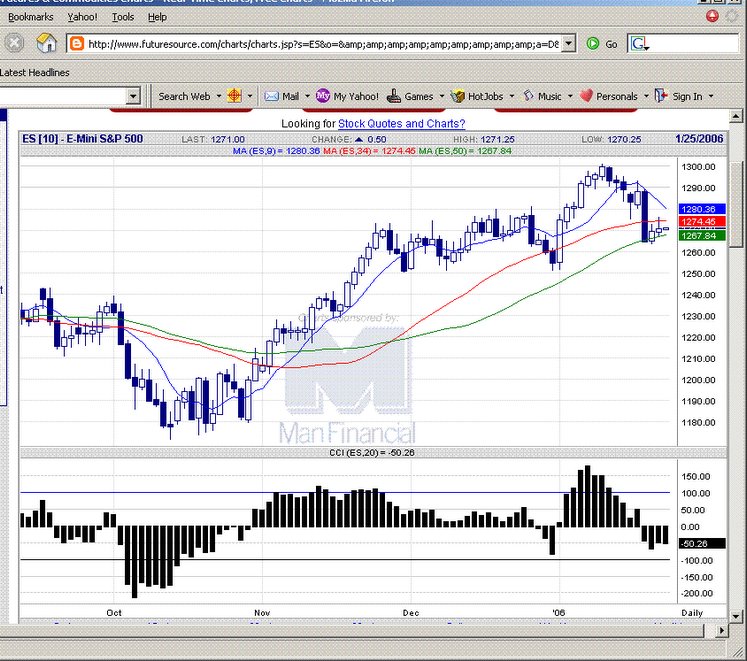
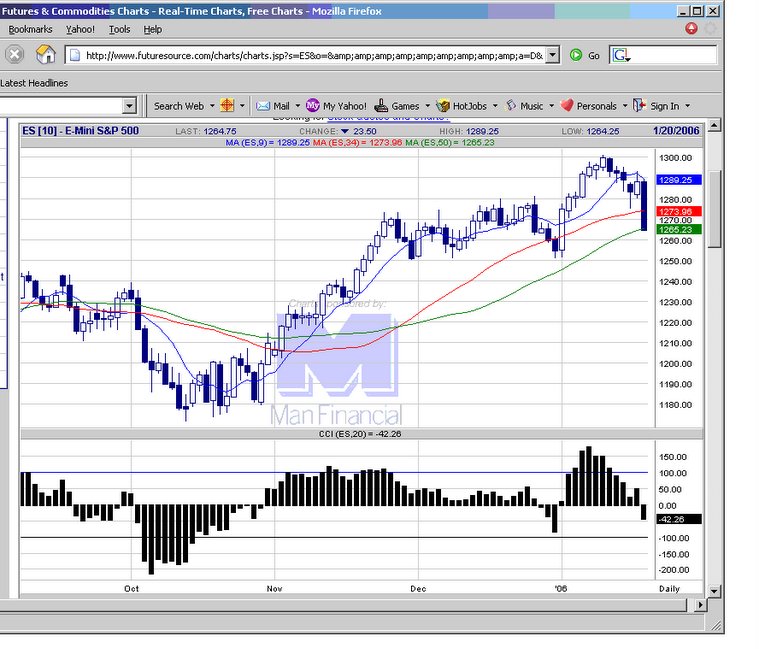 20060120 Market plunges due to GE, Citigroup results releaed. In addition options expiration exascerbate the falls. 1272 support gave way very easily. Bulls need to generate the momentum which is now waning, so in the week ahead could be volatile non direction trade.
E-mini S&P 500 chart
20060120 Market plunges due to GE, Citigroup results releaed. In addition options expiration exascerbate the falls. 1272 support gave way very easily. Bulls need to generate the momentum which is now waning, so in the week ahead could be volatile non direction trade.
E-mini S&P 500 chart
posted by emacro @ 5:33 PM
0 comments
![]()
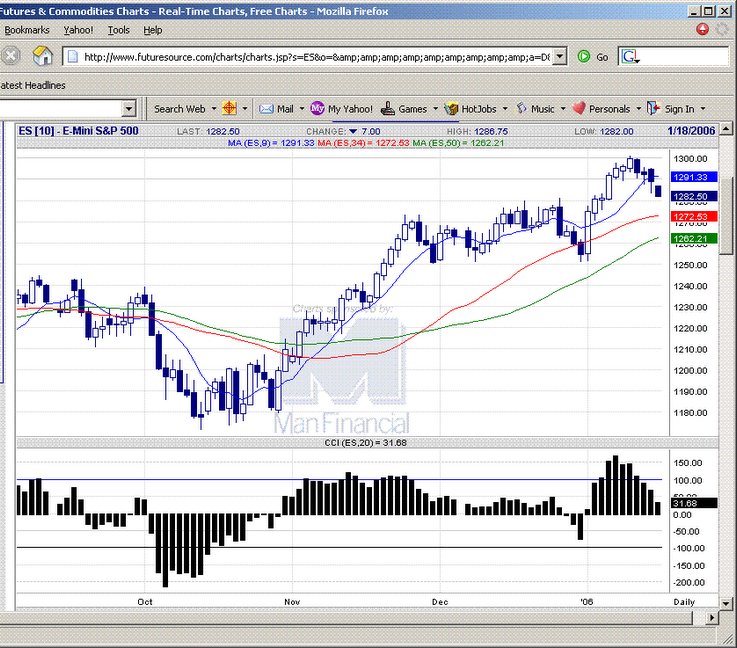
 20060118 As we identified on 17 Jan, 1272 was the key level which provided the underlying support for the ES to bounce to close off lows.
E-mini S&P 500 chart
20060118 As we identified on 17 Jan, 1272 was the key level which provided the underlying support for the ES to bounce to close off lows.
E-mini S&P 500 chart
posted by emacro @ 4:01 PM
0 comments
![]()
posted by emacro @ 4:53 PM
0 comments
![]()
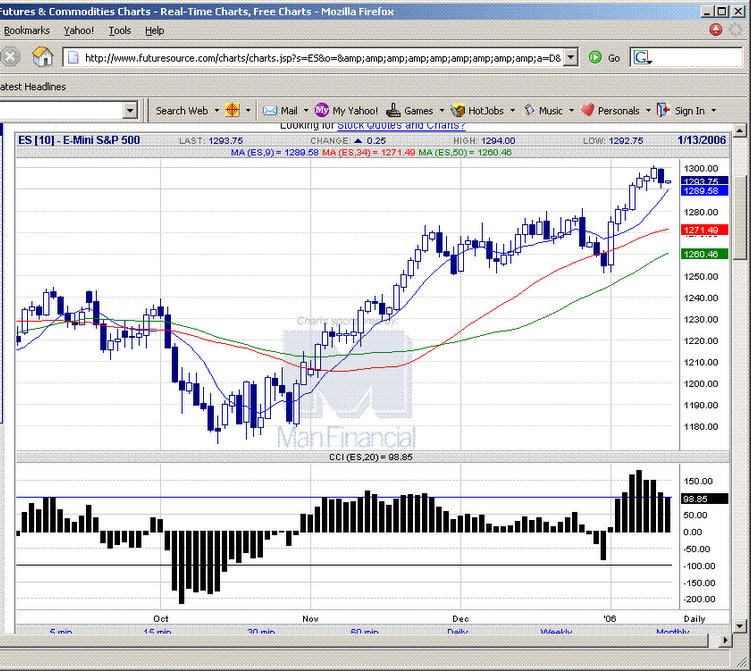
 20060113 Bounces off the 9 ema support 1288 today. Downside support 1271, which might test next week, seeing the momentum on the CCI waning now.
E-mini S&P 500 chart
20060113 Bounces off the 9 ema support 1288 today. Downside support 1271, which might test next week, seeing the momentum on the CCI waning now.
E-mini S&P 500 chart
posted by emacro @ 7:25 PM
0 comments
![]()
 20060112 Gaps down and close low, candlestick indicates selling, which could be profit taking after the hefty gains we see in the first sessions in 2006. Good thing the candlestick pattern is not an engulfing bearish, which would have then been a reversal pattern.
E-mini S&P 500 chart
20060112 Gaps down and close low, candlestick indicates selling, which could be profit taking after the hefty gains we see in the first sessions in 2006. Good thing the candlestick pattern is not an engulfing bearish, which would have then been a reversal pattern.
E-mini S&P 500 chart
posted by emacro @ 5:15 PM
0 comments
![]()
posted by emacro @ 4:18 PM
0 comments
![]()
 20060110 A seloff in the morning, with strong buyers pushing up to close near highs, a sign of strength in the market.
E-mini S&P 500 chart
20060110 A seloff in the morning, with strong buyers pushing up to close near highs, a sign of strength in the market.
E-mini S&P 500 chart
posted by emacro @ 9:30 PM
0 comments
![]()
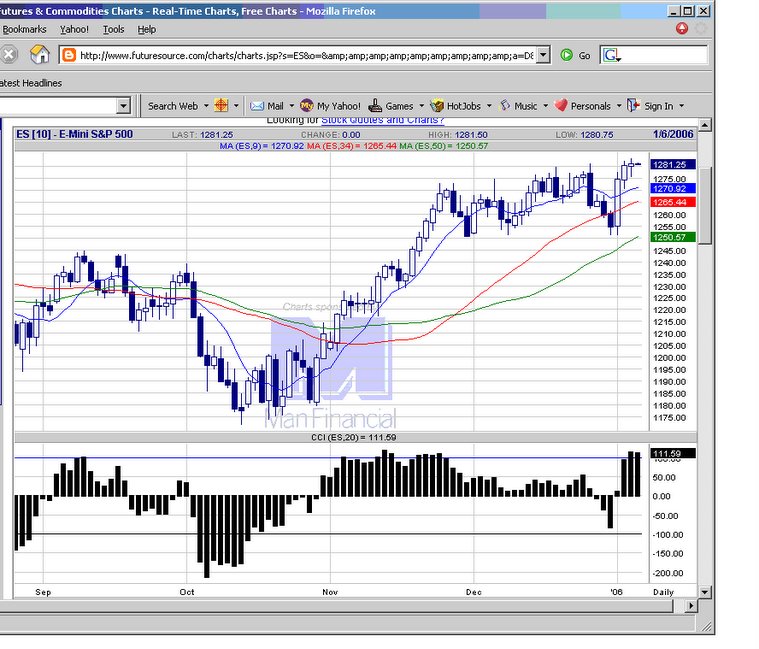
 20060106 Big candlestick shows buying interest, continuation of the uptrend. CCI is positive and rising.
E-mini S&P 500 chart
20060106 Big candlestick shows buying interest, continuation of the uptrend. CCI is positive and rising.
E-mini S&P 500 chart
posted by emacro @ 6:18 PM
0 comments
![]()
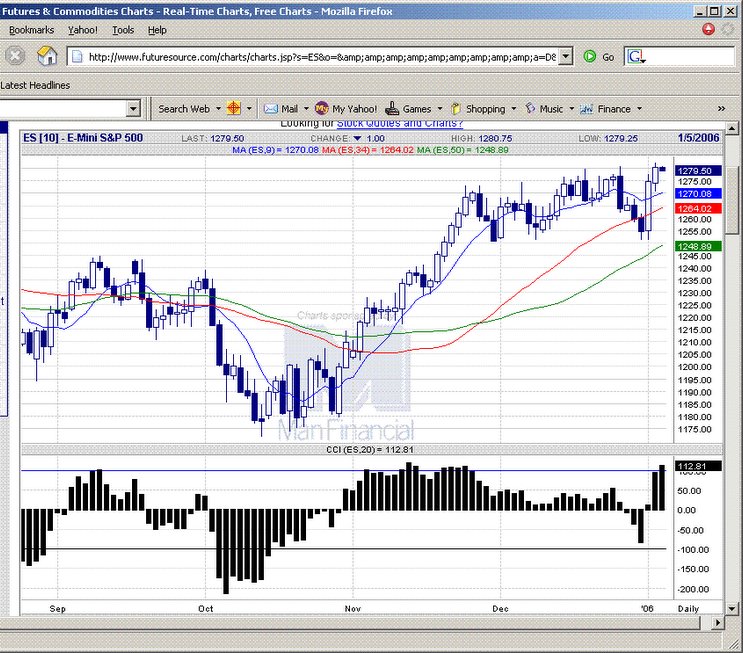
 20060105 A doji candlestick, indicates tussle at resistance. 1270 remains good buy area.
E-mini S&P 500 chart
20060105 A doji candlestick, indicates tussle at resistance. 1270 remains good buy area.
E-mini S&P 500 chart
posted by emacro @ 4:02 PM
0 comments
![]()
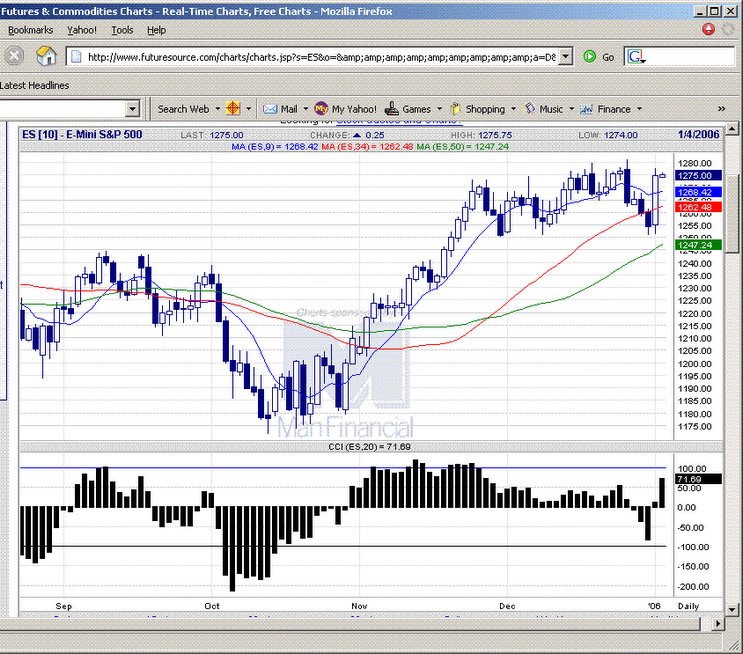
 20060104 Rally continues. 1270 may be a good support level to long for continuation.
E-mini S&P 500 chart
20060104 Rally continues. 1270 may be a good support level to long for continuation.
E-mini S&P 500 chart
posted by emacro @ 4:13 PM
0 comments
![]()
 20060103 Holds the 1250 level, which now proves good support. An early sell off from worse than expected construction spending numbers, followed by a stunning reversal and strong rally sparked by the release of the FOMC minutes.
E-mini S&P 500 chart
20060103 Holds the 1250 level, which now proves good support. An early sell off from worse than expected construction spending numbers, followed by a stunning reversal and strong rally sparked by the release of the FOMC minutes.
E-mini S&P 500 chart
posted by emacro @ 4:02 PM
0 comments
![]()