posted by emacro @ 4:05 PM
0 comments
![]()
S&P 500 Charts
Chronicle of trading in ES S&P 500 index futures using momentum indicator CCI. Charts by www.futuresource.com. Note: The content here are for educational purposes only. Nothing in this blog constitute advice to buy or sell financial instruments and should not be construed as 'investment advice'.
Tuesday, November 28, 2006
Monday, November 27, 2006
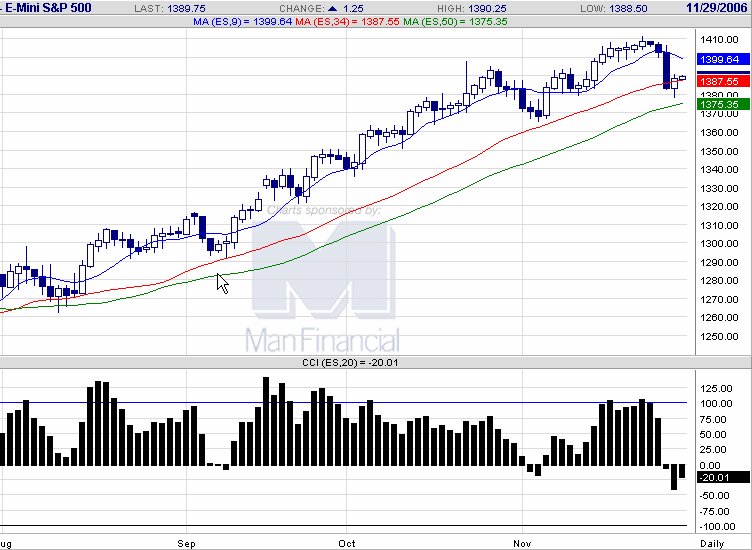
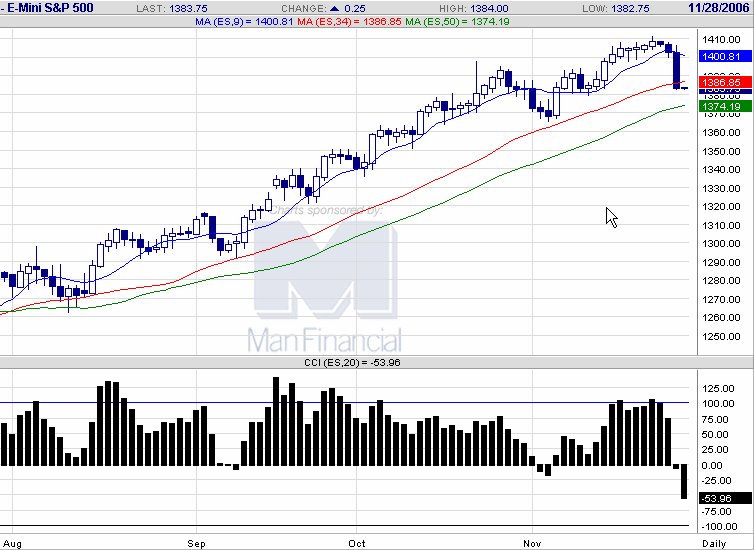 20061127 ES breaks and has it's biggest decline in 4 months. This is precipitated by the USD fall during the past 3 trading sessions. CCI moves below zero, so this correction has downside momentum building.
  E-mini S&P 500 chart
posted by emacro @ 4:27 PM
0 comments
![]()
Friday, November 24, 2006
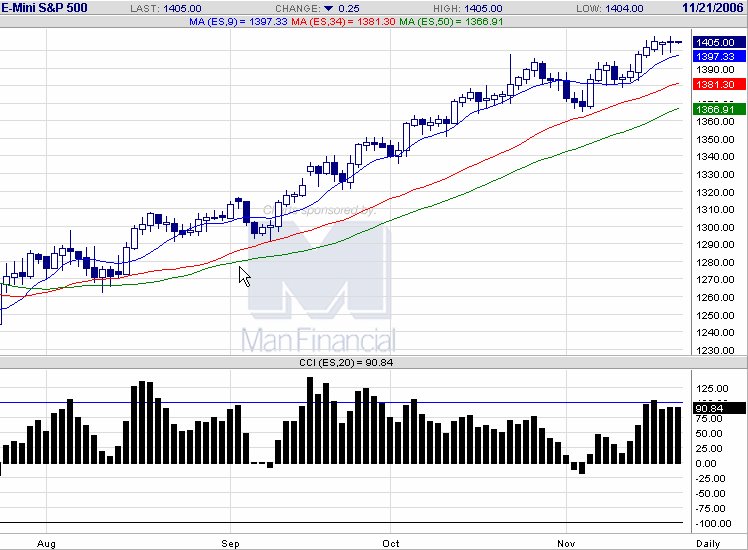
Tuesday, November 21, 2006
posted by emacro @ 3:47 PM
0 comments
![]()
Monday, November 20, 2006
Friday, November 17, 2006
 20061117 Buyers stepped into lower levels to push the ES back up, to form a 'shooting star' candlestick pattern. A break below the low of today's pattern indicates a short trade for reversal. It is interesting how many commentators, news, TV stations etc are conjecturing on the stock market's rise, citing reasons such as soft landing, interest rate cut speculation. But all these are hype and noise. The reason for the stocks' rise are due to money flowing from the speculative funds that exited the commodities markets into the stock markets.
E-mini S&P 500 chart
20061117 Buyers stepped into lower levels to push the ES back up, to form a 'shooting star' candlestick pattern. A break below the low of today's pattern indicates a short trade for reversal. It is interesting how many commentators, news, TV stations etc are conjecturing on the stock market's rise, citing reasons such as soft landing, interest rate cut speculation. But all these are hype and noise. The reason for the stocks' rise are due to money flowing from the speculative funds that exited the commodities markets into the stock markets.
E-mini S&P 500 chart
posted by emacro @ 7:12 PM
0 comments
![]()
Wednesday, November 15, 2006
 20061116 ES rosses and closes above 1400, a technically significant moment. So much for the "decline of epic proportions" touted by one floor trader on the CME after the Democratic sweep of both houses.
E-mini S&P 500 chart
20061116 ES rosses and closes above 1400, a technically significant moment. So much for the "decline of epic proportions" touted by one floor trader on the CME after the Democratic sweep of both houses.
E-mini S&P 500 chart
posted by emacro @ 4:51 PM
0 comments
![]()
Tuesday, November 14, 2006
posted by emacro @ 3:58 PM
0 comments
![]()
Saturday, November 11, 2006

posted by emacro @ 4:14 AM
0 comments
![]()
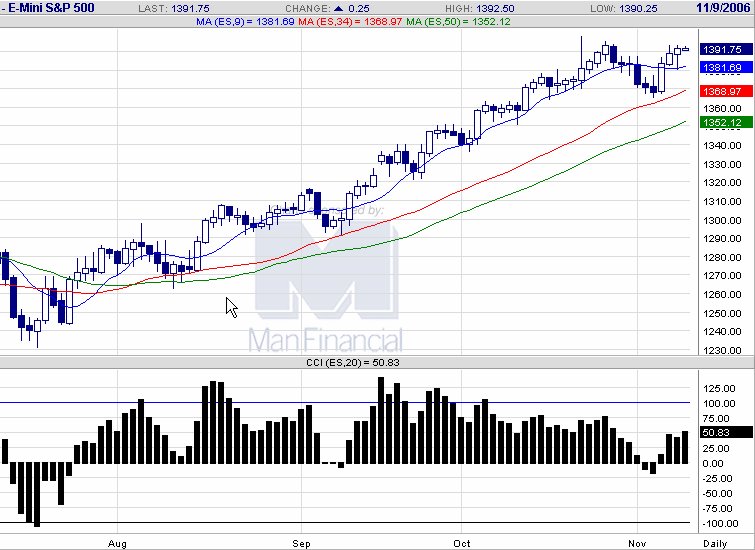
Thursday, November 09, 2006
 20061109 DJIA starts correction, falling 73. ES has chance to get to 1270, so looking for short opportunities.
E-mini S&P 500 chart
20061109 DJIA starts correction, falling 73. ES has chance to get to 1270, so looking for short opportunities.
E-mini S&P 500 chart
posted by emacro @ 5:36 PM
0 comments
![]()
Wednesday, November 08, 2006
 20061108 ES recovers from effects of Democrats win in US elections. Funny, one trader interviewed on Bloomberg TV was calling for a 'selloff of epic proportions'. Well he must have been heavily short, but he is obviously succumbing to emotions and anger or excitement at the 'paper profits' that he would have made on a 'epic selloff'. A look at the bigger picture, would reveal that the $ from Wall St were already flowing into Democrats' coffers a few months prior to today's elections, indicating the financial community support for the democrats, thereby precluding a 'epic selloff' on Republican loss.
E-mini S&P 500 chart
20061108 ES recovers from effects of Democrats win in US elections. Funny, one trader interviewed on Bloomberg TV was calling for a 'selloff of epic proportions'. Well he must have been heavily short, but he is obviously succumbing to emotions and anger or excitement at the 'paper profits' that he would have made on a 'epic selloff'. A look at the bigger picture, would reveal that the $ from Wall St were already flowing into Democrats' coffers a few months prior to today's elections, indicating the financial community support for the democrats, thereby precluding a 'epic selloff' on Republican loss.
E-mini S&P 500 chart
posted by emacro @ 5:28 PM
0 comments
![]()
Tuesday, November 07, 2006
 20061107 ES rallies again, on day of mid term US congressional elections. Could form a double top, but will take a while yet.
E-mini S&P 500 chart
20061107 ES rallies again, on day of mid term US congressional elections. Could form a double top, but will take a while yet.
E-mini S&P 500 chart
posted by emacro @ 4:38 PM
0 comments
![]()
Wednesday, November 01, 2006
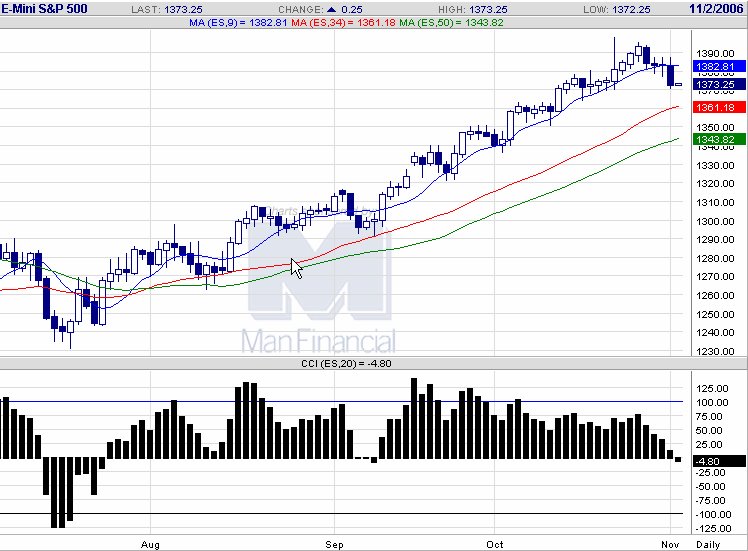 20061101 Break in the ES through 1377 support, which now provides resistance in this downward phase.
E-mini S&P 500 chart
20061101 Break in the ES through 1377 support, which now provides resistance in this downward phase.
E-mini S&P 500 chart
posted by emacro @ 4:39 PM
0 comments
![]()
Sponsors
- 20110525 ES futures 2 min Wolfe wave reaches the o...
- 2011054 A wolfe wave long on ES futures after the ...
- 20110517 A amall 5 min EUR futures wolfe wave, a s...
- 20110517 ES futures, wofe wave long i globex.
- 20110516 Halfway move on Soybean futures, and a de...
- 20110516 ES
- 20110516 ES futures 5 min, woldfe wave in globex s...
- 20110513 ES futures sell on wolfe wave 5 min.
- 5 min ES
- 20110512 July Soybean sutures....5 min.
- June 2005
- July 2005
- August 2005
- September 2005
- October 2005
- November 2005
- December 2005
- January 2006
- February 2006
- March 2006
- April 2006
- May 2006
- June 2006
- July 2006
- August 2006
- September 2006
- October 2006
- November 2006
- December 2006
- January 2007
- February 2007
- March 2007
- April 2007
- May 2007
- June 2007
- July 2007
- August 2007
- September 2007
- October 2007
- November 2007
- June 2008
- August 2008
- September 2008
- October 2008
- November 2008
- December 2008
- March 2009
- March 2010
- May 2010
- July 2010
- August 2010
- September 2010
- October 2010
- March 2011
- April 2011
- May 2011
- Current Posts
Links
Previous Posts
Archives

Syndicate this site


