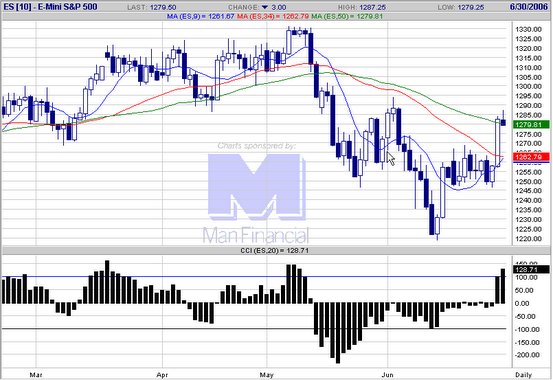
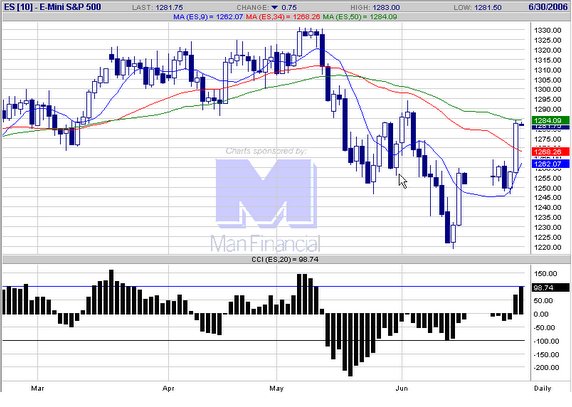
 20060630 A pause after the big rally on Thursday. Plan to look to long retracement into fib levels.
  E-mini S&P 500 chart
posted by emacro @ 8:46 PM
0 comments
![]()
Chronicle of trading in ES S&P 500 index futures using momentum indicator CCI. Charts by www.futuresource.com. Note: The content here are for educational purposes only. Nothing in this blog constitute advice to buy or sell financial instruments and should not be construed as 'investment advice'.
20060630 A pause after the big rally on Thursday. Plan to look to long retracement into fib levels.
E-mini S&P 500 chart
posted by emacro @ 8:46 PM
0 comments
![]()
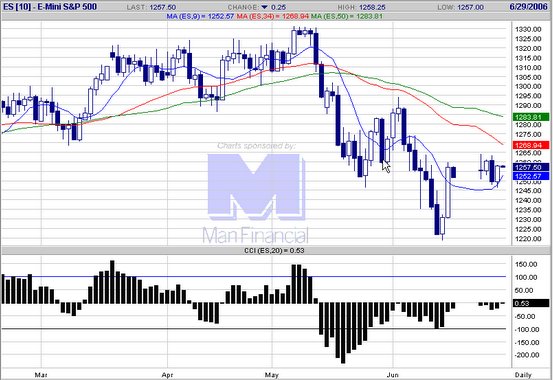
 20060629 ES breaks out of consolidation, could be in trending phase. Looking to buy pullbacks to the moving average.
E-mini S&P 500 chart
20060629 ES breaks out of consolidation, could be in trending phase. Looking to buy pullbacks to the moving average.
E-mini S&P 500 chart
posted by emacro @ 6:27 PM
0 comments
![]()
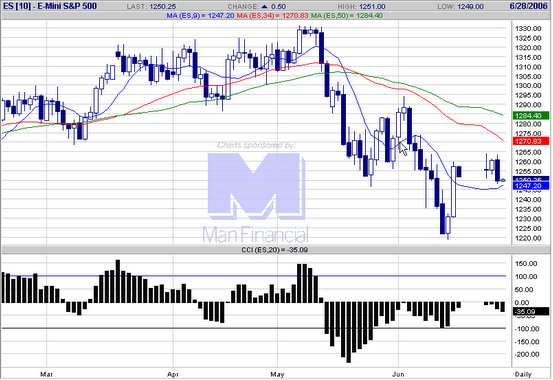
 20060628 ES failed to follow through to the downside. Waiting for the FOMC decision to decide next move.
E-mini S&P 500 chart
20060628 ES failed to follow through to the downside. Waiting for the FOMC decision to decide next move.
E-mini S&P 500 chart
posted by emacro @ 5:20 PM
0 comments
![]()
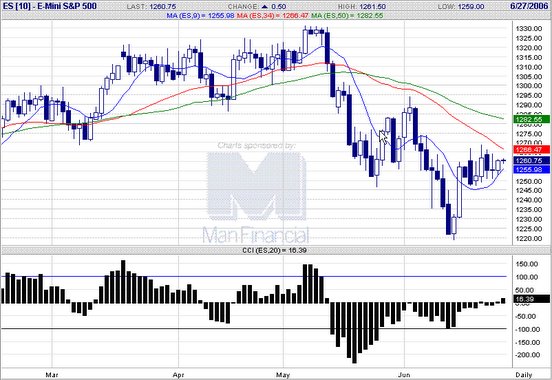
 20060627 Ahead of the 2 day FOMC meeting 28/6, ES breaks out of 1242 level, out of the double ID pattern. Expecting some follow through to the downside.
E-mini S&P 500 chart
20060627 Ahead of the 2 day FOMC meeting 28/6, ES breaks out of 1242 level, out of the double ID pattern. Expecting some follow through to the downside.
E-mini S&P 500 chart
posted by emacro @ 11:25 PM
0 comments
![]()
 20060626 ES is congesting, forming tight coiled spring. Should be breakout coming.
E-mini S&P 500 chart
20060626 ES is congesting, forming tight coiled spring. Should be breakout coming.
E-mini S&P 500 chart
posted by emacro @ 6:37 PM
0 comments
![]()
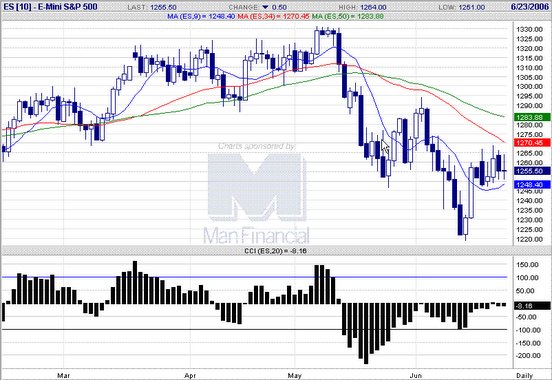 20060623 ES showing 2 Inside Day patterns. Breakout of 1265 or breakdown of 1248 signals long and short respectively.
E-mini S&P 500 chart
20060623 ES showing 2 Inside Day patterns. Breakout of 1265 or breakdown of 1248 signals long and short respectively.
E-mini S&P 500 chart
posted by emacro @ 1:05 AM
0 comments
![]()
 20060621 A 'morning star' continuation candlestick buy signal, with CCI momentum confirmation.
E-mini S&P 500 chart
20060621 A 'morning star' continuation candlestick buy signal, with CCI momentum confirmation.
E-mini S&P 500 chart
posted by emacro @ 5:43 PM
0 comments
![]()
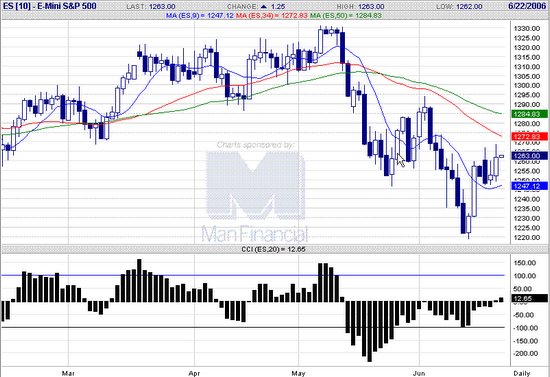
 20060620 Forms a 'spinning top' inside day. May look for breakout of this range.
E-mini S&P 500 chart
20060620 Forms a 'spinning top' inside day. May look for breakout of this range.
E-mini S&P 500 chart
posted by emacro @ 7:43 PM
0 comments
![]()
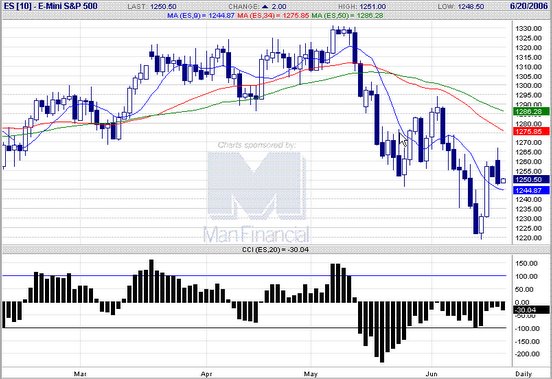 20060619 Engulfing bearish formation, with CCI ZLR sell signal. Breaking 1244 moving avg will see retest of the lows.
E-mini S&P 500 chart
20060619 Engulfing bearish formation, with CCI ZLR sell signal. Breaking 1244 moving avg will see retest of the lows.
E-mini S&P 500 chart
posted by emacro @ 6:08 PM
0 comments
![]()
posted by emacro @ 6:14 PM
0 comments
![]()
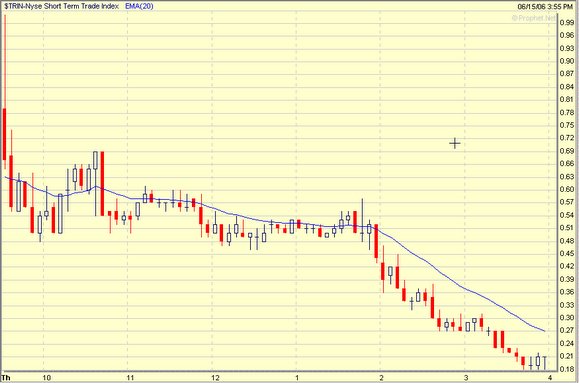
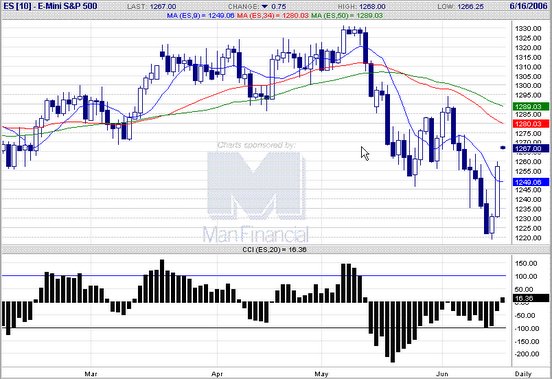 20060615 The CCI divergence, capitulation conditions borne out in the strong rally today. Resistance at the 34 ema.
E-mini S&P 500 chart
20060615 The CCI divergence, capitulation conditions borne out in the strong rally today. Resistance at the 34 ema.
E-mini S&P 500 chart
posted by emacro @ 6:13 PM
0 comments
![]()
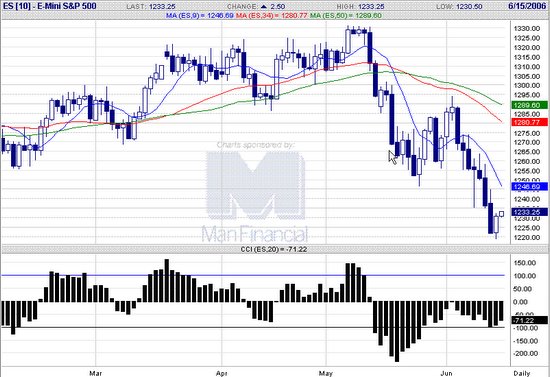 20060614 The expected capitulation rally eventuated off support at 1220. Needs a close above 1230 today to indicate ocntinuation.
E-mini S&P 500 chart
20060614 The expected capitulation rally eventuated off support at 1220. Needs a close above 1230 today to indicate ocntinuation.
E-mini S&P 500 chart
posted by emacro @ 4:55 PM
0 comments
![]()
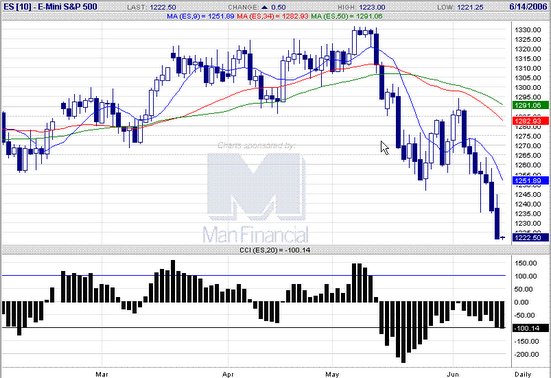 20060613 Capitulation on the cards.
E-mini S&P 500 chart
20060613 Capitulation on the cards.
E-mini S&P 500 chart
posted by emacro @ 5:49 PM
0 comments
![]()
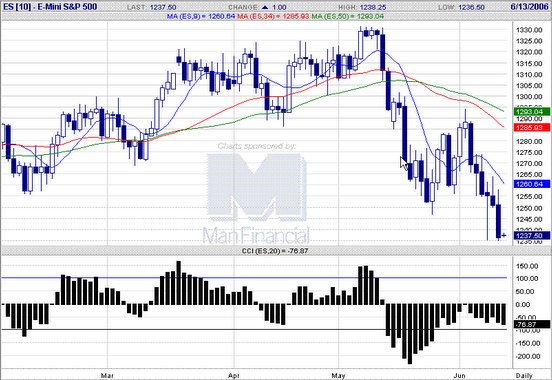 20060612 Closes below the key 1247 level. ES needs to get back above 1245 to be out of immediate danger.
E-mini S&P 500 chart
20060612 Closes below the key 1247 level. ES needs to get back above 1245 to be out of immediate danger.
E-mini S&P 500 chart
posted by emacro @ 7:16 PM
0 comments
![]()
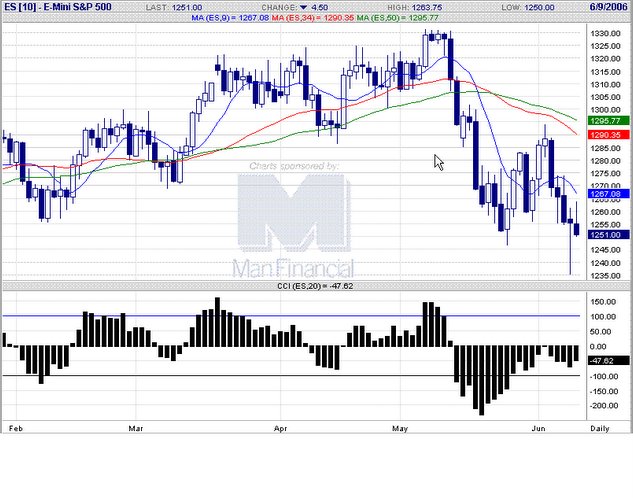 20060609 ES price action fails to confirm the hammer reversal, being unable to sustain gains. But as long as 1247 and then 1235 holds, we have a chance to bounce higher.
E-mini S&P 500 chart
20060609 ES price action fails to confirm the hammer reversal, being unable to sustain gains. But as long as 1247 and then 1235 holds, we have a chance to bounce higher.
E-mini S&P 500 chart
posted by emacro @ 8:54 PM
0 comments
![]()

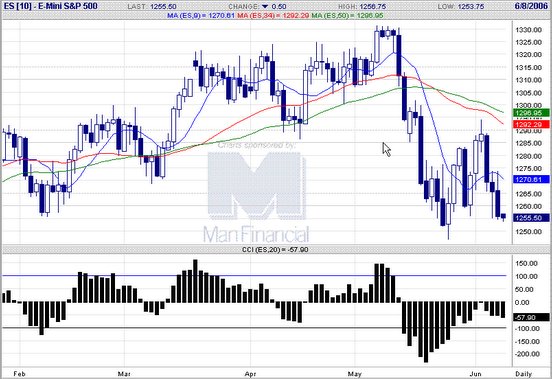
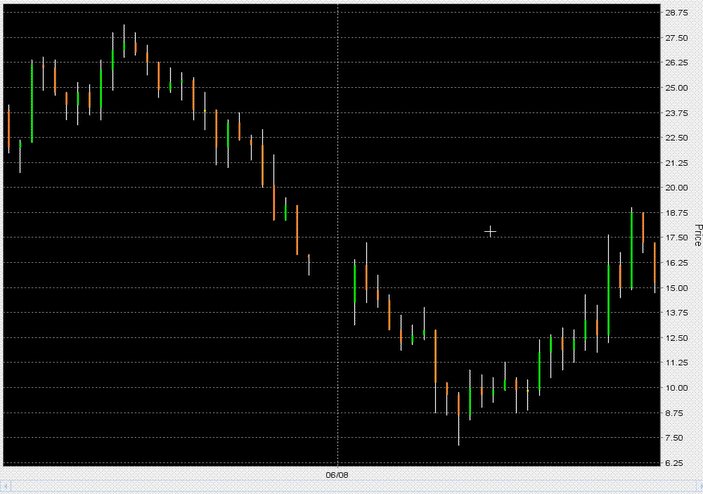 20060608 The ES morning sell off was an example of capitulation setup. 3 consecutive -1000 readings on the NYSE TICK could have given heads up on irrational selling. We long the ES June 1250 calls at 9.50 to take advantage of a potential rebound. In addition, the combined CBOE put call ratio spent the entir e day above 1.0, which is a contrarian indicator not to position trade short today
E-mini S&P 500 chart
20060608 The ES morning sell off was an example of capitulation setup. 3 consecutive -1000 readings on the NYSE TICK could have given heads up on irrational selling. We long the ES June 1250 calls at 9.50 to take advantage of a potential rebound. In addition, the combined CBOE put call ratio spent the entir e day above 1.0, which is a contrarian indicator not to position trade short today
E-mini S&P 500 chart
posted by emacro @ 7:25 PM
0 comments
![]()
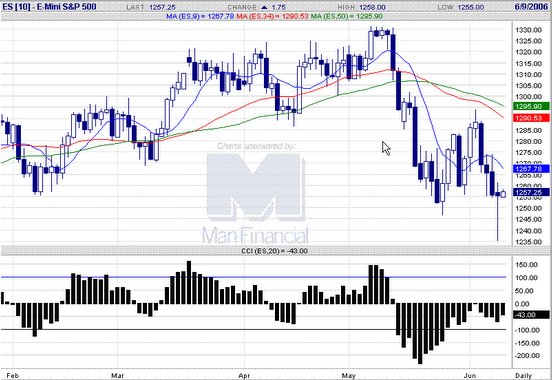 20060608 ES shows a bullish reversal hammer pattern which is expected to see rebound continue for 2 to 3 days.
E-mini S&P 500 chart
20060608 ES shows a bullish reversal hammer pattern which is expected to see rebound continue for 2 to 3 days.
E-mini S&P 500 chart
posted by emacro @ 5:01 PM
0 comments
![]()
posted by emacro @ 5:51 PM
0 comments
![]()
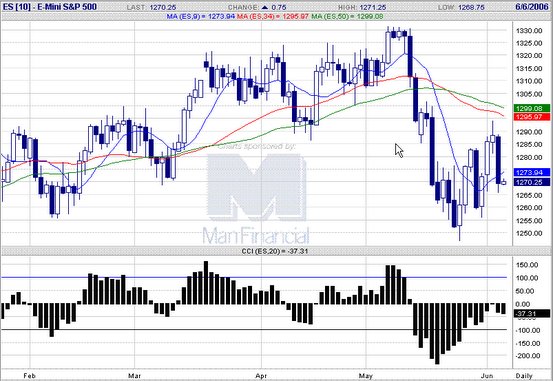
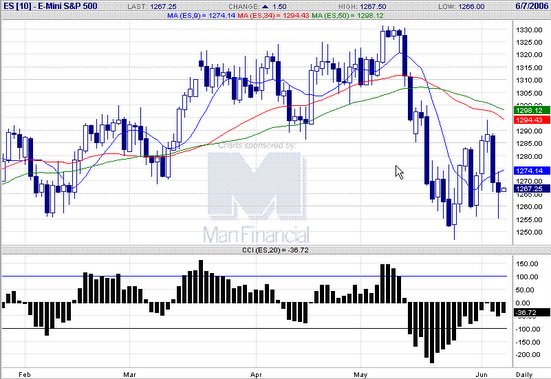 20060606 Tests support and makes new low. Looking for close above 1274 to go long for potential reversal trade.
E-mini S&P 500 chart
20060606 Tests support and makes new low. Looking for close above 1274 to go long for potential reversal trade.
E-mini S&P 500 chart
posted by emacro @ 10:29 PM
0 comments
![]()
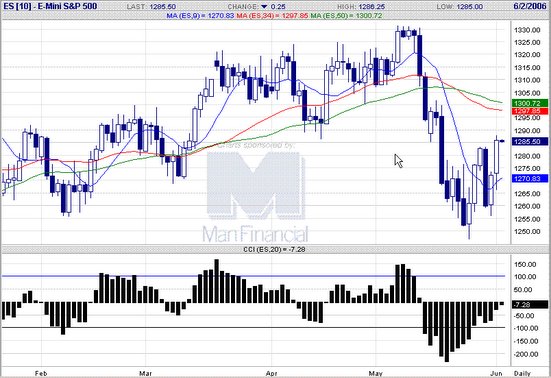
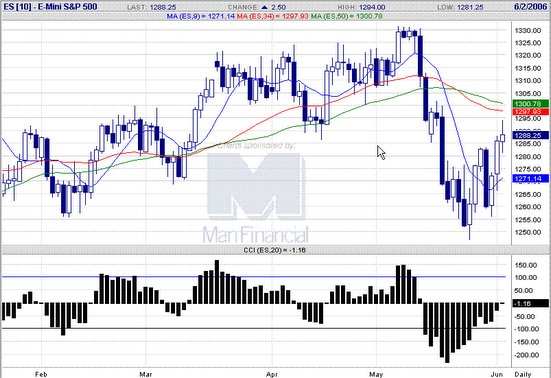 20060602 Continuation of the rebound, off the morning star reversal candlestick formation.
E-mini S&P 500 chart
20060602 Continuation of the rebound, off the morning star reversal candlestick formation.
E-mini S&P 500 chart
posted by emacro @ 8:53 PM
0 comments
![]()
posted by emacro @ 5:07 PM
0 comments
![]()