Friday, December 30, 2005

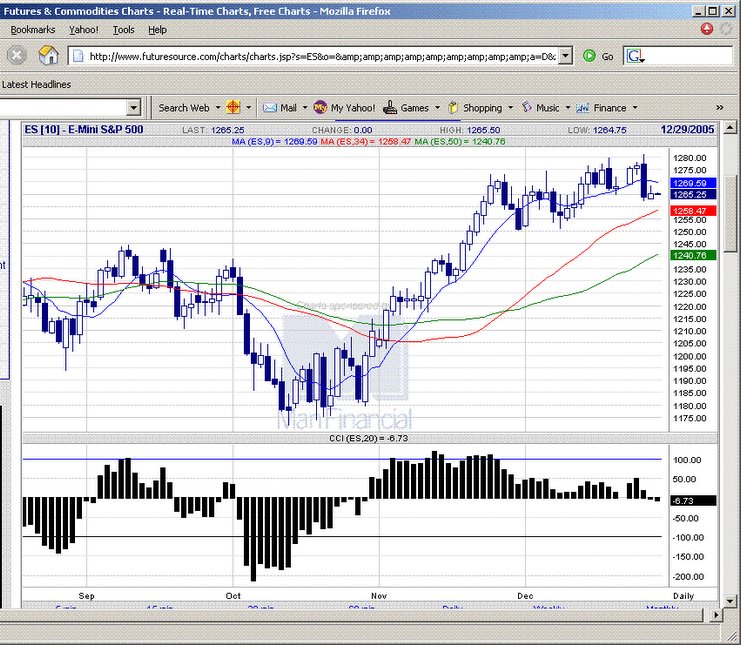
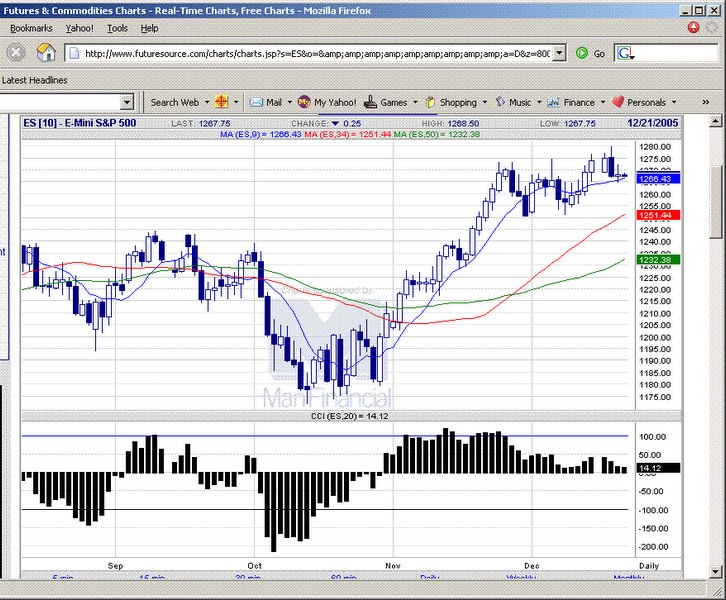
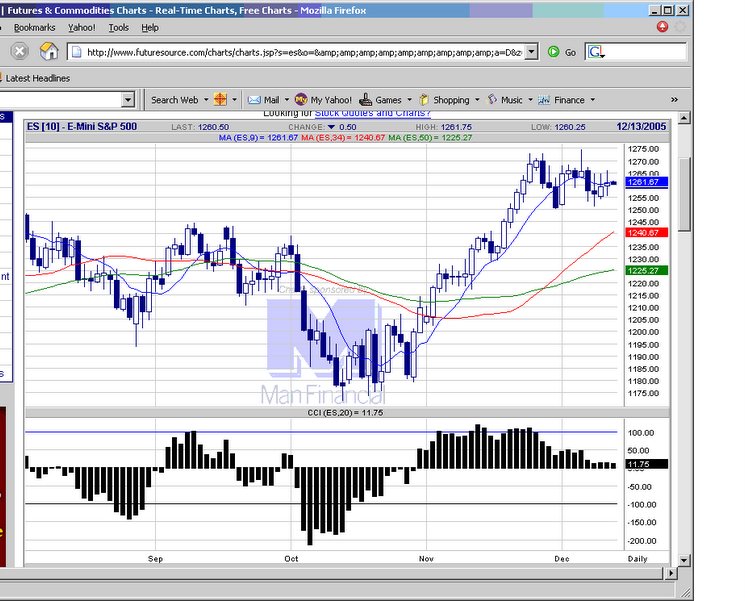
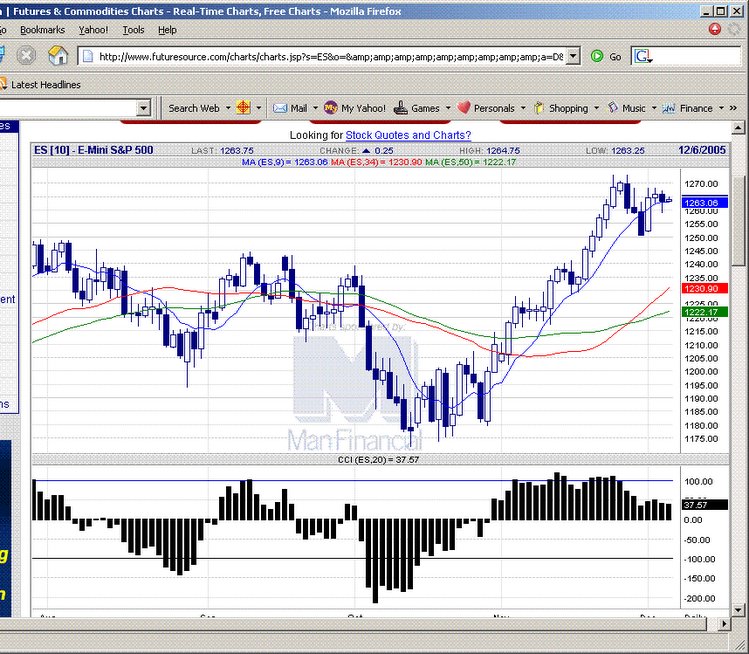
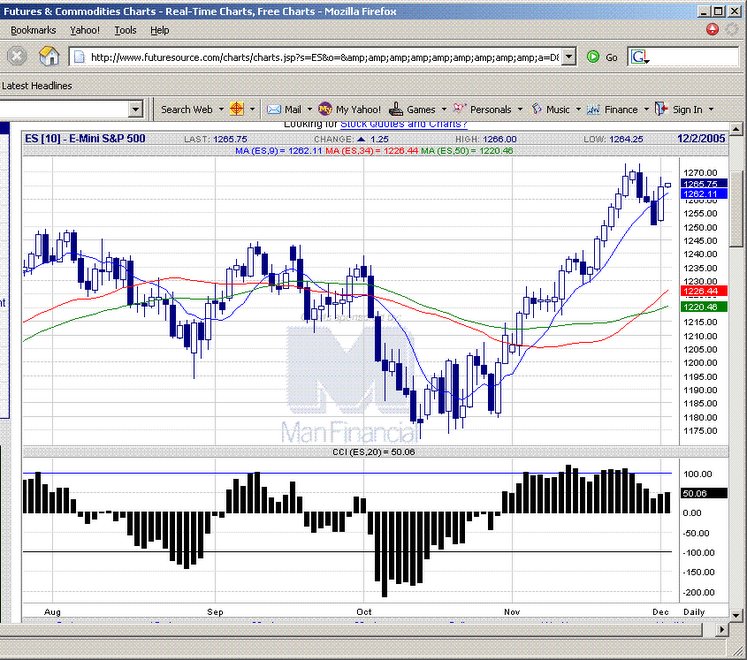
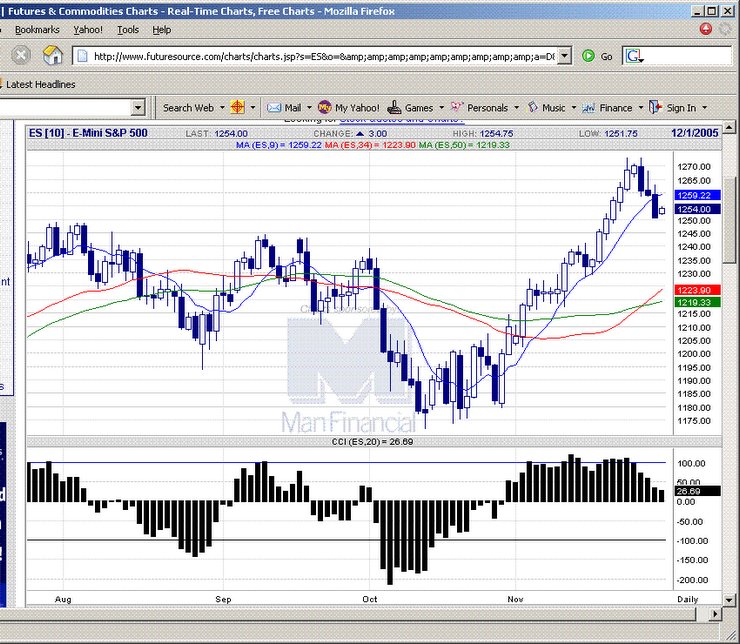
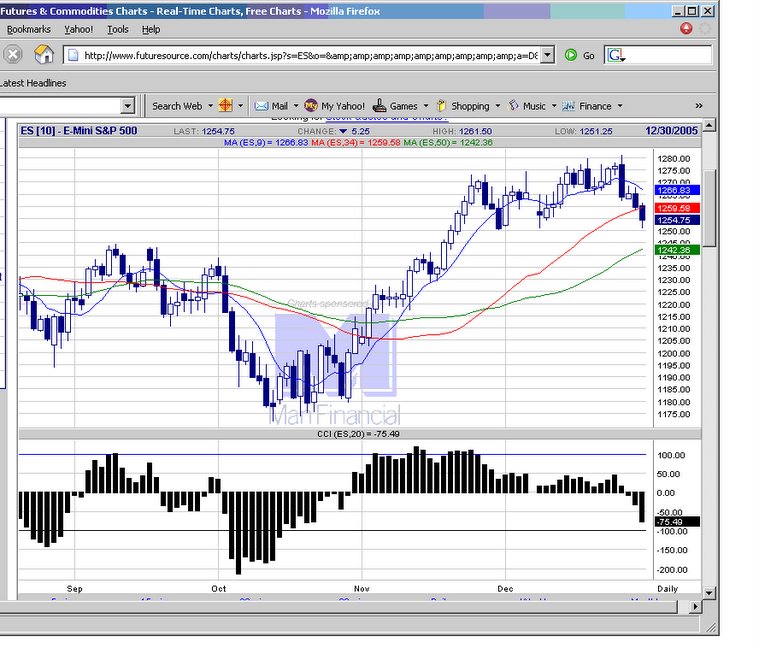
20051230 CCI momentum building to downside, with break of the moving average support. Next level to watch is 1250, to see whether buyers step in. Ends 2005 with negative tone. Posted by Picasa

E-mini S&P 500 chart


Thursday, December 29, 2005

20051229 1250 remins in focus in order to maintain uptrend. Posted by Picasa

E-mini S&P 500 chart


Wednesday, December 28, 2005

20051228 Still within the range. 1250 remains key, needs to hold above this level for further gains to sustain. CCI is snaking sideways around the zero line, supporting the hypothesis of chop in the ES. Posted by Picasa

E-mini S&P 500 chart


Tuesday, December 27, 2005

20051227 Breaks the moving average support, a previous swing ow and CCI turns negative. 3 factors that suggest a reversal taking place. Posted by Picasa

E-mini S&P 500 chart


Friday, December 23, 2005

20051223 Quiet trade, but still continues the uptrend. Posted by Picasa

E-mini S&P 500 chart


Thursday, December 22, 2005

20051222 CCI momentum shows bullish pattern gaining momentum. Today the NY transport workers agreed to go back to work after the 2 day strike, bolstering the market. Posted by Picasa

E-mini S&P 500 chart


Wednesday, December 21, 2005

20051221 Candlestick shows selling driving prices down t the close, which is not a good technical sign for the bull going forward. Posted by Picasa

E-mini S&P 500 chart


Tuesday, December 20, 2005

20051220 Holding the moving average support. Posted by Picasa

E-mini S&P 500 chart


Monday, December 19, 2005

20051219 Coming up to moving average support. If fails to hold, might go down to the next ma level. Posted by Picasa

E-mini S&P 500 chart


Sunday, December 18, 2005

20051216 ES futures. Posted by Picasa

E-mini S&P 500 chart


Wednesday, December 14, 2005

20051214 Breaks another new high, confirming the trend in place until otherwise. Posted by Picasa

E-mini S&P 500 chart


Tuesday, December 13, 2005

20051213 FOMC raises interest rates 25 bp, changes the wording by dropping "accomodation" from polic statement. Rally continues. Posted by Picasa

E-mini S&P 500 chart


Monday, December 12, 2005

20051212 Indecisive price action, a giant doji pattern on the candlesticks. Posted by Picasa

E-mini S&P 500 chart


Friday, December 09, 2005

20051209 Sideways action continues. Posted by Picasa

E-mini S&P 500 chart


Thursday, December 08, 2005

20051208 Consolidates further in the 1250-75 range, until it breaks out price action not too meaningful. Posted by Picasa

E-mini S&P 500 chart


Tuesday, December 06, 2005

20051206 Made new high, but unable to sustain. Scribing the sideways price action. Posted by Picasa

E-mini S&P 500 chart


Monday, December 05, 2005

20051206 Sideways action, could be bullish continuatin pattern forming, considering the good upside CCI momentum. Posted by Picasa

E-mini S&P 500 chart


20051206 Sideways action, could be forming a symmetrical triangle pattern for breakout soon. Posted by Picasa

E-mini S&P 500 chart


Thursday, December 01, 2005

20051201 CCI shows buy signal with ZLR and close aboe the 9 ema could signal continuatin of the trend. Posted by Picasa

E-mini S&P 500 chart


20051130 Not reacting well to the 9 ema support level. Maybe need a period of consolidation and rest before resuming uptrend. Posted by Picasa

E-mini S&P 500 chart