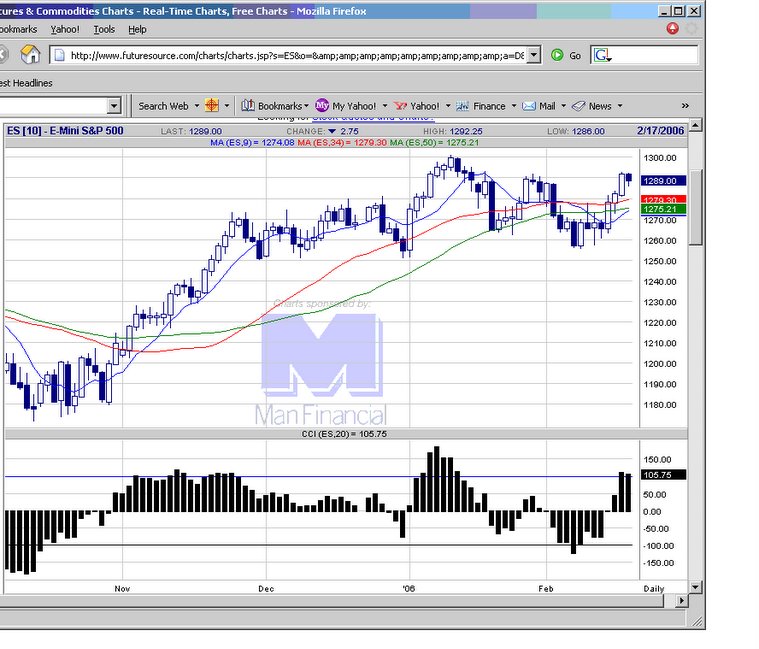
 20060217 1260 to 1290 range. Upper resistance is confirmed somewhat form today's failure to maintain above 1290.
  E-mini S&P 500 chart
posted by emacro @ 5:22 PM
0 comments
![]()
Chronicle of trading in ES S&P 500 index futures using momentum indicator CCI. Charts by www.futuresource.com. Note: The content here are for educational purposes only. Nothing in this blog constitute advice to buy or sell financial instruments and should not be construed as 'investment advice'.
20060217 1260 to 1290 range. Upper resistance is confirmed somewhat form today's failure to maintain above 1290.
E-mini S&P 500 chart
posted by emacro @ 5:22 PM
0 comments
![]()


0 Comments:
Post a Comment
<< Home