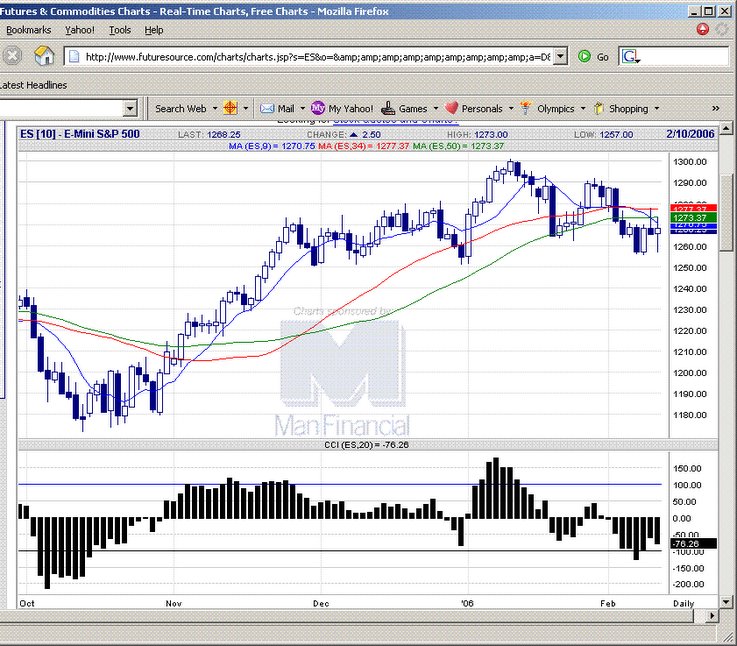
 20060210 H&S pattern looks like stalling into sideways consolidation now. Range 1255-1275. Look for breakout of this range.
  E-mini S&P 500 chart
posted by emacro @ 5:16 PM
0 comments
![]()
Chronicle of trading in ES S&P 500 index futures using momentum indicator CCI. Charts by www.futuresource.com. Note: The content here are for educational purposes only. Nothing in this blog constitute advice to buy or sell financial instruments and should not be construed as 'investment advice'.
20060210 H&S pattern looks like stalling into sideways consolidation now. Range 1255-1275. Look for breakout of this range.
E-mini S&P 500 chart
posted by emacro @ 5:16 PM
0 comments
![]()


0 Comments:
Post a Comment
<< Home