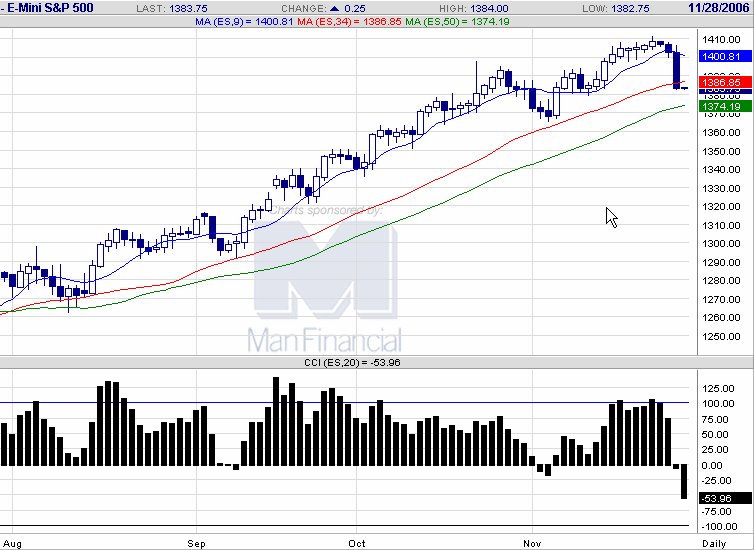
 20061127 ES breaks and has it's biggest decline in 4 months. This is precipitated by the USD fall during the past 3 trading sessions. CCI moves below zero, so this correction has downside momentum building.
  E-mini S&P 500 chart
posted by emacro @ 4:27 PM
0 comments
![]()


0 Comments:
Post a Comment
<< Home