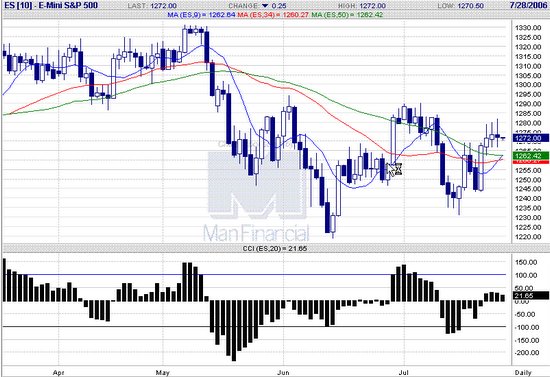
 20060727 Long tailed candlesticks on ES indicates selling. Needs to break above 1285 convincingly to push higher.
  E-mini S&P 500 chart
posted by emacro @ 9:03 PM
0 comments
![]()
Chronicle of trading in ES S&P 500 index futures using momentum indicator CCI. Charts by www.futuresource.com. Note: The content here are for educational purposes only. Nothing in this blog constitute advice to buy or sell financial instruments and should not be construed as 'investment advice'.
20060727 Long tailed candlesticks on ES indicates selling. Needs to break above 1285 convincingly to push higher.
E-mini S&P 500 chart
posted by emacro @ 9:03 PM
0 comments
![]()


0 Comments:
Post a Comment
<< Home