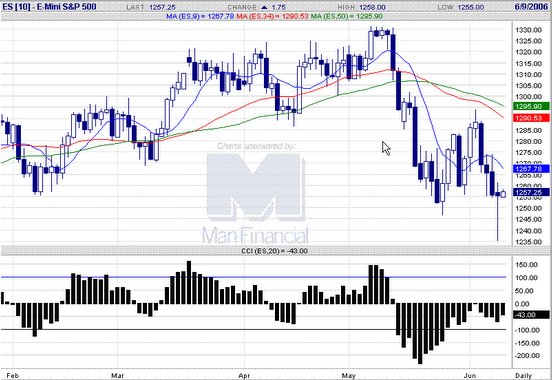
 20060608 ES shows a bullish reversal hammer pattern which is expected to see rebound continue for 2 to 3 days.
  E-mini S&P 500 chart
posted by emacro @ 5:01 PM
0 comments
![]()
Chronicle of trading in ES S&P 500 index futures using momentum indicator CCI. Charts by www.futuresource.com. Note: The content here are for educational purposes only. Nothing in this blog constitute advice to buy or sell financial instruments and should not be construed as 'investment advice'.
20060608 ES shows a bullish reversal hammer pattern which is expected to see rebound continue for 2 to 3 days.
E-mini S&P 500 chart
posted by emacro @ 5:01 PM
0 comments
![]()


0 Comments:
Post a Comment
<< Home