 20051129 ES coming to supprt from the 9 ema, after which next level will be the 18 ema.
  E-mini S&P 500 chart
posted by emacro @ 3:48 PM
0 comments
![]()
Chronicle of trading in ES S&P 500 index futures using momentum indicator CCI. Charts by www.futuresource.com. Note: The content here are for educational purposes only. Nothing in this blog constitute advice to buy or sell financial instruments and should not be construed as 'investment advice'.
20051129 ES coming to supprt from the 9 ema, after which next level will be the 18 ema.
E-mini S&P 500 chart
posted by emacro @ 3:48 PM
0 comments
![]()
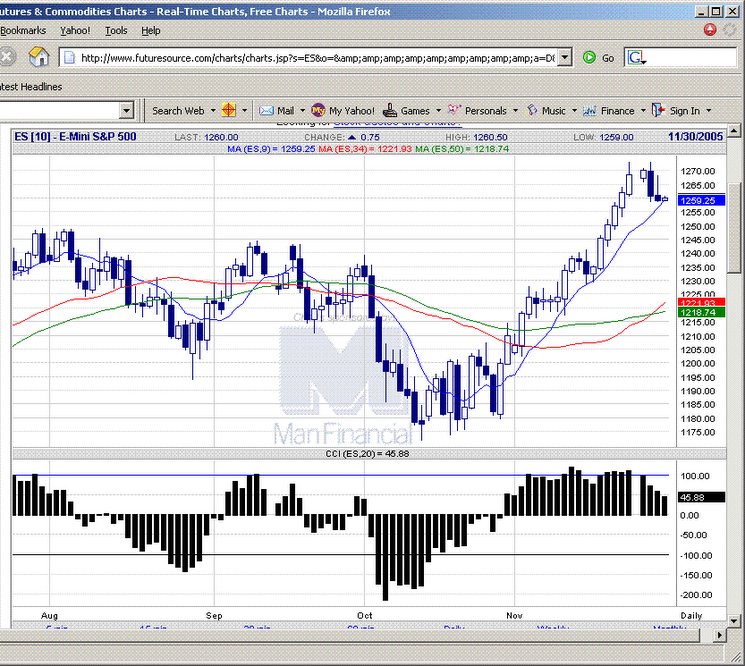
 20051128 A pause in the rally, is an example of 'the trend dows not go on forever.' Looking to see reaction at the ema support for the next trade.
E-mini S&P 500 chart
20051128 A pause in the rally, is an example of 'the trend dows not go on forever.' Looking to see reaction at the ema support for the next trade.
E-mini S&P 500 chart
posted by emacro @ 3:43 PM
0 comments
![]()
posted by emacro @ 6:27 PM
0 comments
![]()
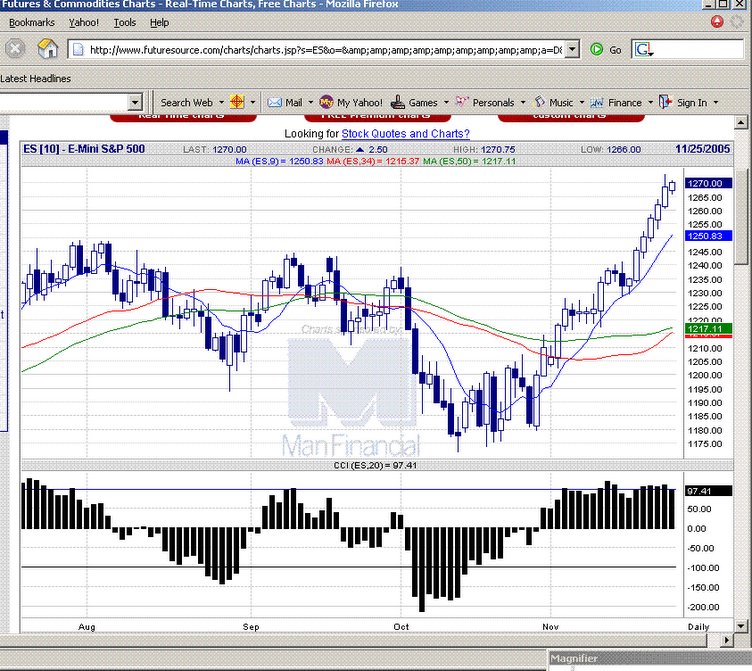
 20051123 the bull continues into Thanksgiving holidays. Today consumer sentiment surveys surprise to upside.
E-mini S&P 500 chart
20051123 the bull continues into Thanksgiving holidays. Today consumer sentiment surveys surprise to upside.
E-mini S&P 500 chart
posted by emacro @ 5:07 PM
0 comments
![]()
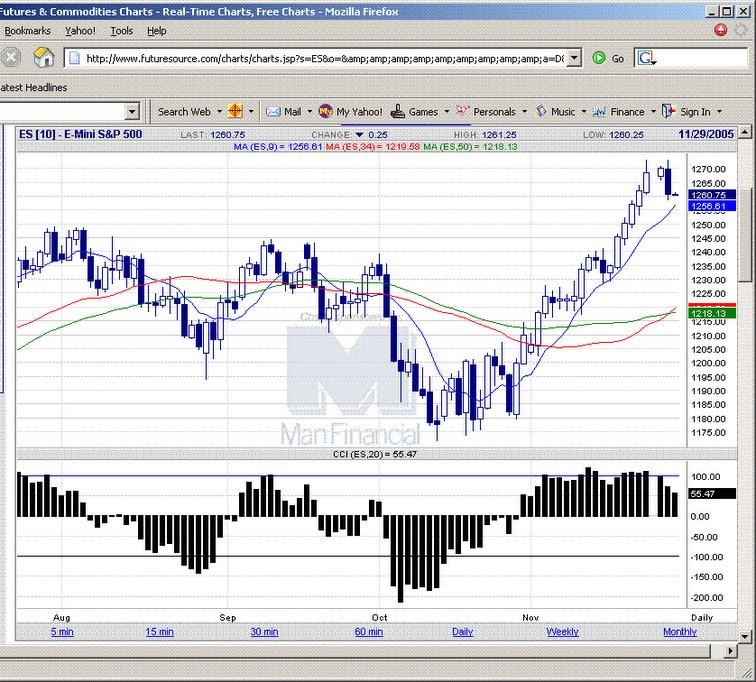
 20051122 ES broke all major resistances, powered by the release of Fed minutes of the last FOMC meeting, indicating slowing down of interest rate hike possible. Bullish, waiting for pullbacks to long.
E-mini S&P 500 chart
20051122 ES broke all major resistances, powered by the release of Fed minutes of the last FOMC meeting, indicating slowing down of interest rate hike possible. Bullish, waiting for pullbacks to long.
E-mini S&P 500 chart
posted by emacro @ 6:01 PM
0 comments
![]()
posted by emacro @ 3:59 PM
0 comments
![]()
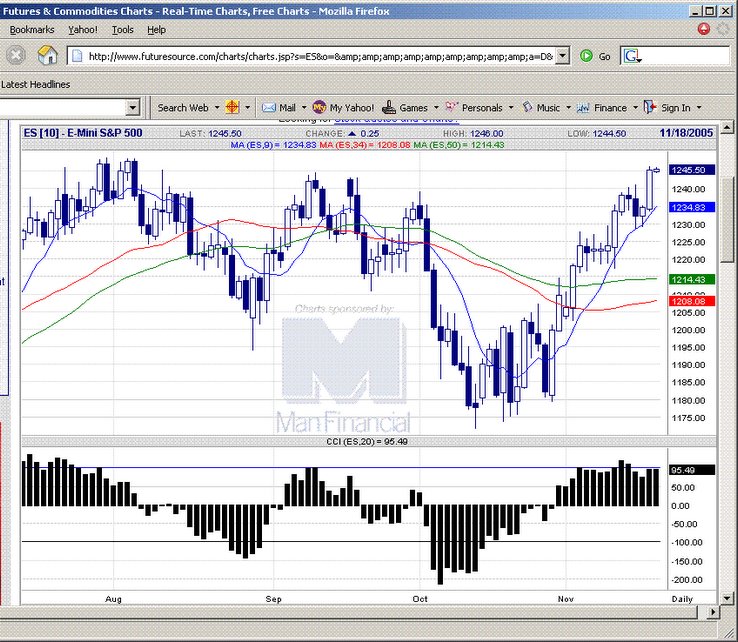
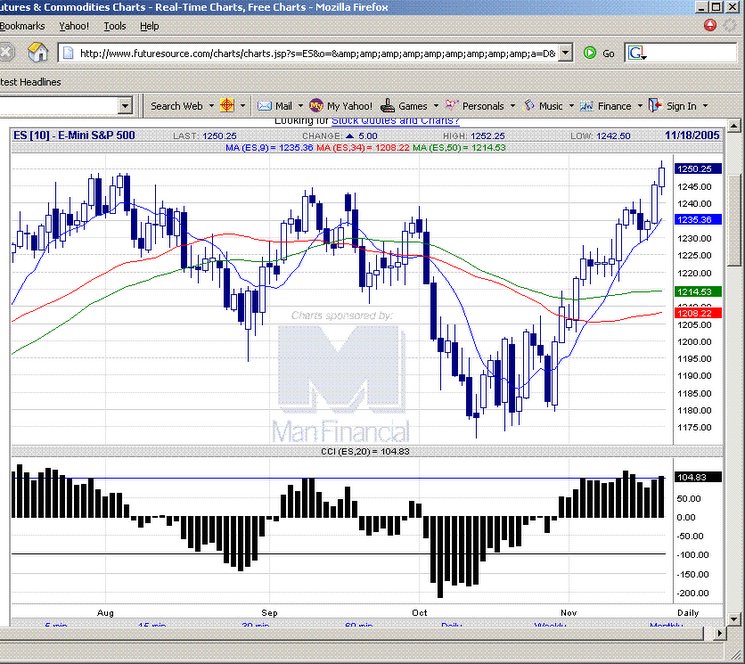 20051118 Resting just above old resistance levels at 1250 n the close. CCI remains positive, but could possibly see some profit taking next week.
E-mini S&P 500 chart
20051118 Resting just above old resistance levels at 1250 n the close. CCI remains positive, but could possibly see some profit taking next week.
E-mini S&P 500 chart
posted by emacro @ 2:56 AM
0 comments
![]()
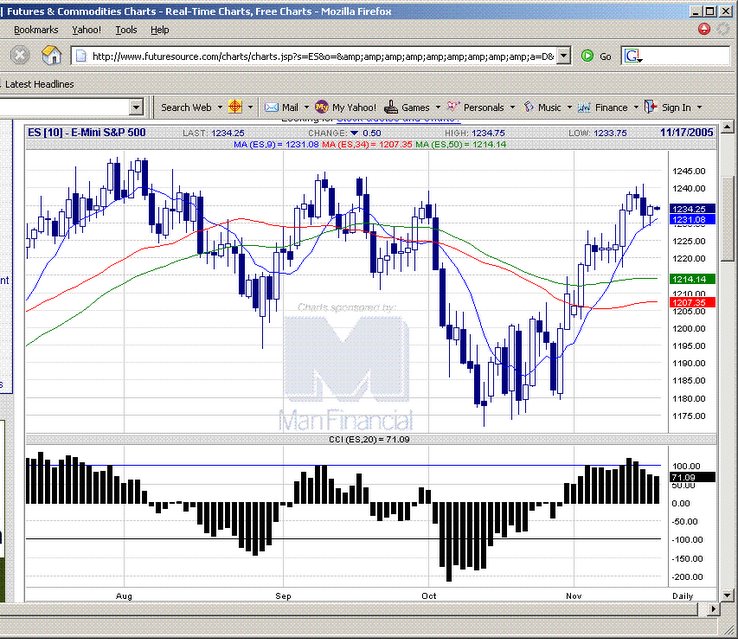
 20051117 As expected, the mov avg provided the springboard support for the move up.
E-mini S&P 500 chart
20051117 As expected, the mov avg provided the springboard support for the move up.
E-mini S&P 500 chart
posted by emacro @ 5:15 PM
0 comments
![]()
 20051117 The ema provided the support and springboard for the move higher, capitalizing on good CCI upside momentum.
E-mini S&P 500 chart
20051117 The ema provided the support and springboard for the move higher, capitalizing on good CCI upside momentum.
E-mini S&P 500 chart
posted by emacro @ 5:06 PM
0 comments
![]()
 20051116 Testing the moving average, which provides good support for entry into the uptrend, considering the CCI is strongly positive.
E-mini S&P 500 chart
20051116 Testing the moving average, which provides good support for entry into the uptrend, considering the CCI is strongly positive.
E-mini S&P 500 chart
posted by emacro @ 11:34 PM
0 comments
![]()
 20051115 Candlestick shows some selling interest, but held the ma support, have to see whether this level can hold in the coming sessions.
E-mini S&P 500 chart
20051115 Candlestick shows some selling interest, but held the ma support, have to see whether this level can hold in the coming sessions.
E-mini S&P 500 chart
posted by emacro @ 4:28 PM
0 comments
![]()
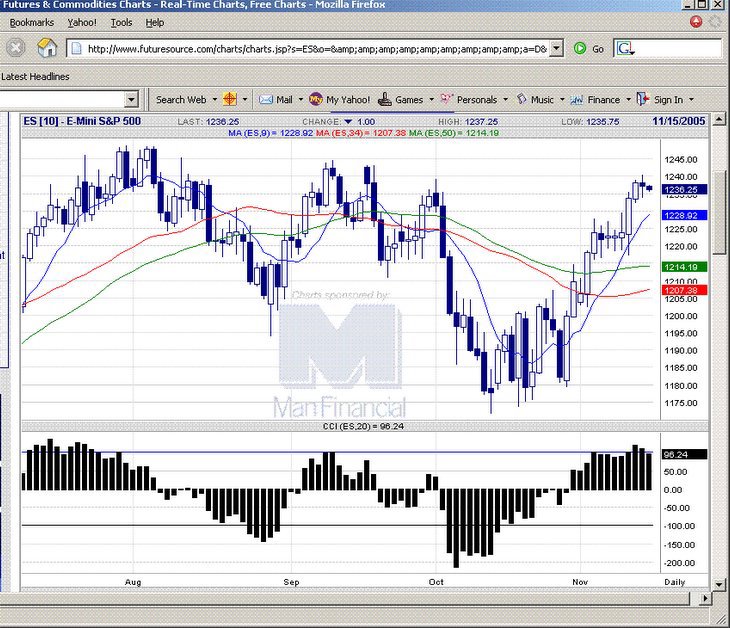 20051114 ES is at extended levels. Taking profits or buying some in the money Dec puts could be a viable trading idea.
E-mini S&P 500 chart
20051114 ES is at extended levels. Taking profits or buying some in the money Dec puts could be a viable trading idea.
E-mini S&P 500 chart
posted by emacro @ 4:12 PM
0 comments
![]()
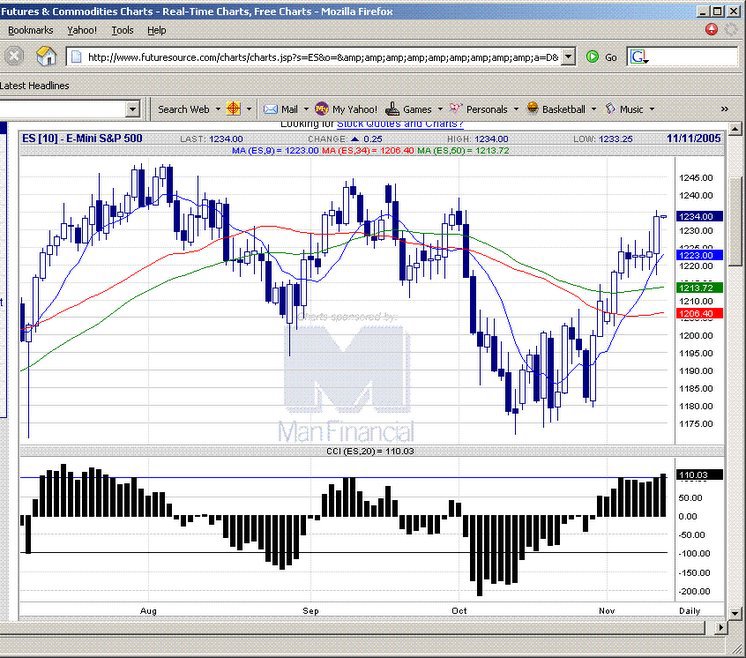
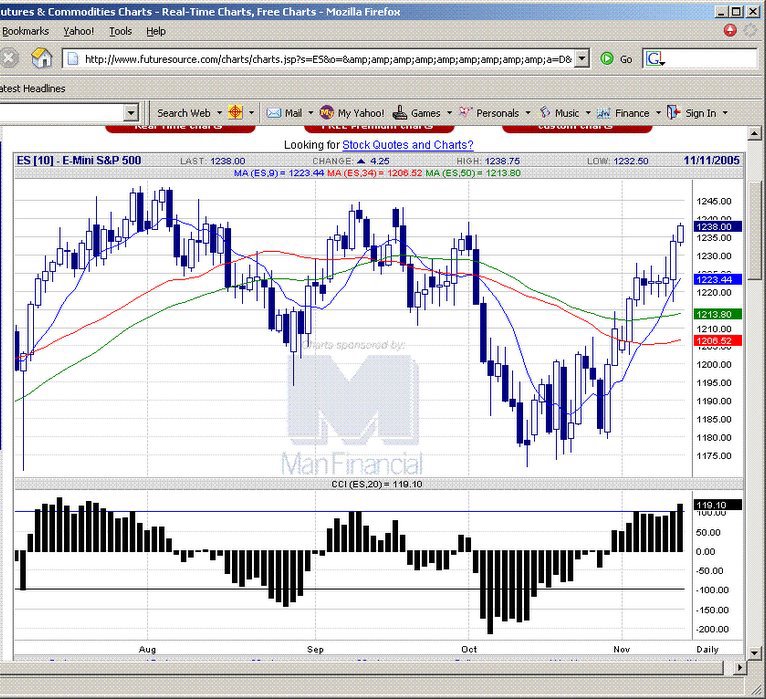 20051111 Another day of up action. Would look for opportunity to scalp a short back to the 1224 level, then to long from there. CCI momentum is above +100.
E-mini S&P 500 chart
20051111 Another day of up action. Would look for opportunity to scalp a short back to the 1224 level, then to long from there. CCI momentum is above +100.
E-mini S&P 500 chart
posted by emacro @ 6:04 PM
0 comments
![]()
 20051110 Break higher. Bullish pattern, buying on tests of the mov avg turns out to be prudent.
E-mini S&P 500 chart
20051110 Break higher. Bullish pattern, buying on tests of the mov avg turns out to be prudent.
E-mini S&P 500 chart
posted by emacro @ 6:30 PM
0 comments
![]()
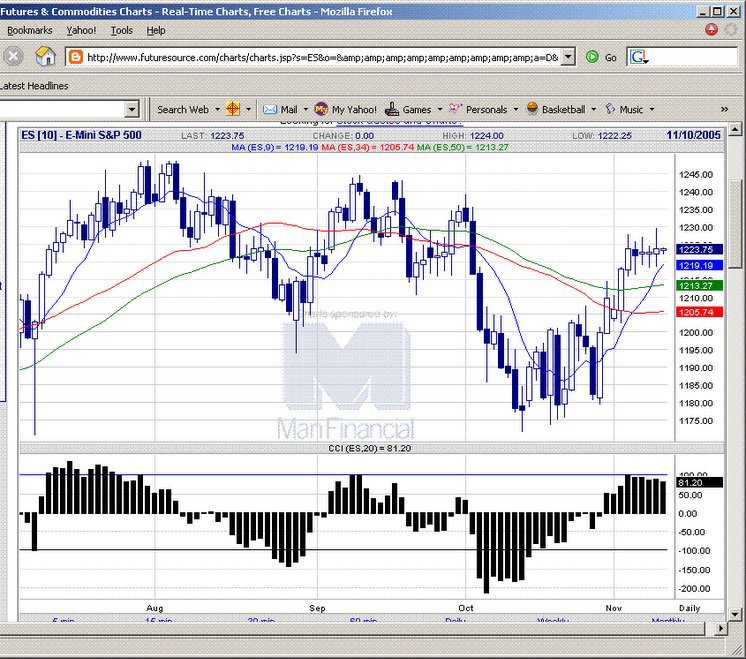 20051110 Support provided at 1213 b the mov avg. High overhead resistance and weakening CCI momentum could see a test of those levels.
E-mini S&P 500 chart
20051110 Support provided at 1213 b the mov avg. High overhead resistance and weakening CCI momentum could see a test of those levels.
E-mini S&P 500 chart
posted by emacro @ 11:28 PM
0 comments
![]()
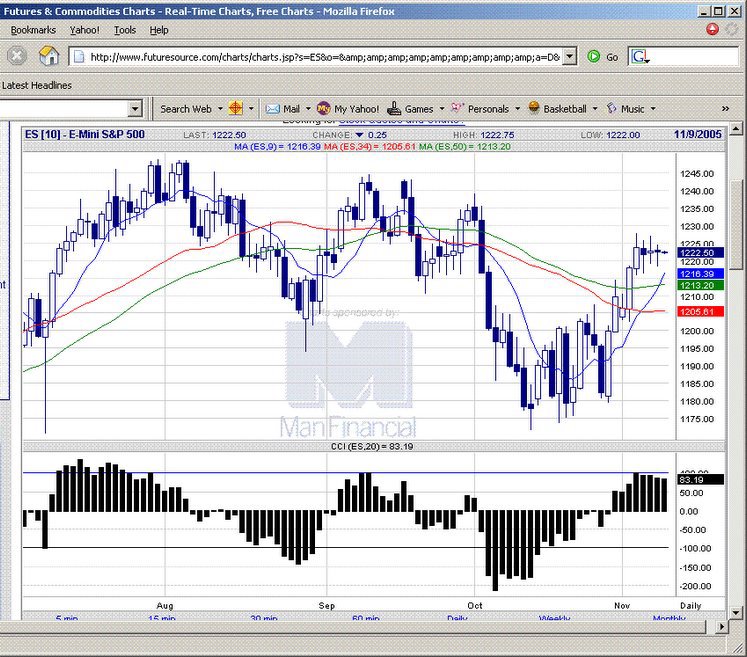 20051108 Sideways action after the strong run up, should be bullish on balance. Future price action however will determine and confirm this. CCI momentum lends support to this.
E-mini S&P 500 chart
20051108 Sideways action after the strong run up, should be bullish on balance. Future price action however will determine and confirm this. CCI momentum lends support to this.
E-mini S&P 500 chart
posted by emacro @ 5:23 PM
0 comments
![]()
 20051107 An ID candlestick, which points to breakout either side, bias though on upside.
E-mini S&P 500 chart
20051107 An ID candlestick, which points to breakout either side, bias though on upside.
E-mini S&P 500 chart
posted by emacro @ 5:01 PM
0 comments
![]()
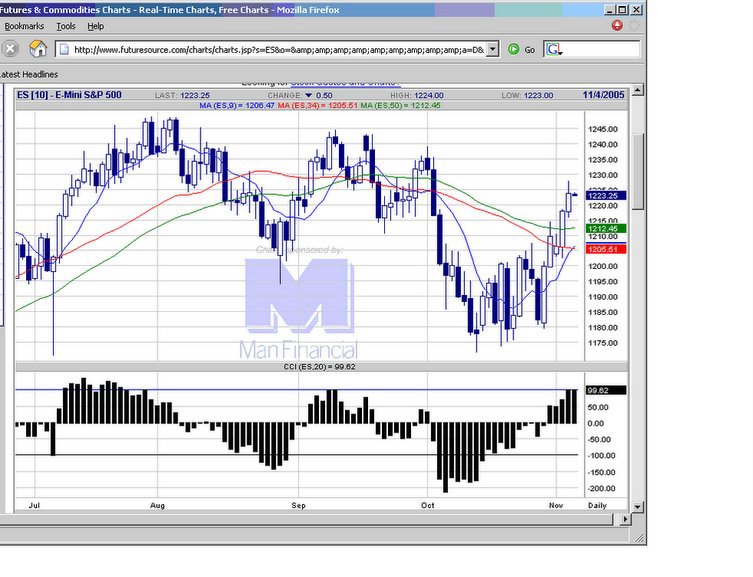
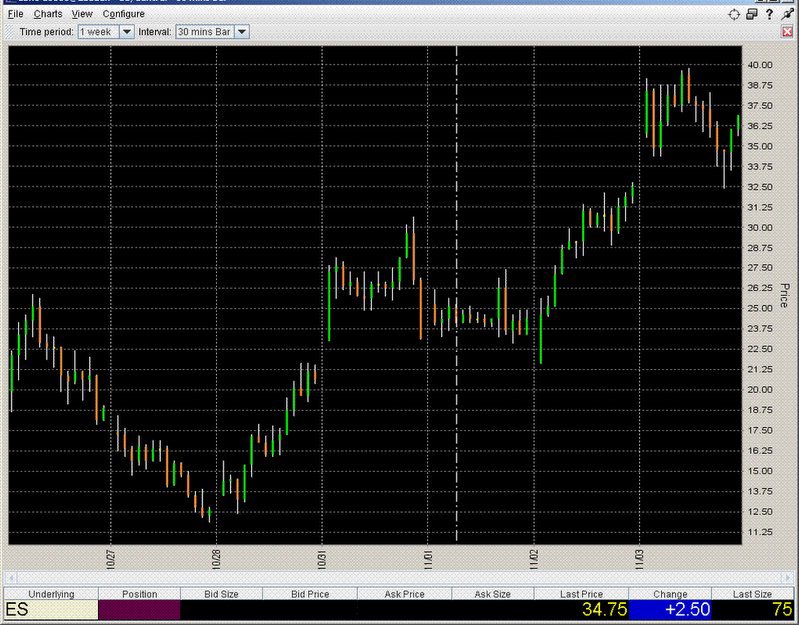 20051103 Update on the ES option position. Well, a 5 day trade risking 4 points with provit of over 20 points. To recap, the position was entered when all hell broke loose last Thursday, when all the stressed out day traders were trading intraday shorts. Patience and discipline to stick with the plan rewards the trader.
E-mini S&P 500 chart
20051103 Update on the ES option position. Well, a 5 day trade risking 4 points with provit of over 20 points. To recap, the position was entered when all hell broke loose last Thursday, when all the stressed out day traders were trading intraday shorts. Patience and discipline to stick with the plan rewards the trader.
E-mini S&P 500 chart
posted by emacro @ 5:47 PM
0 comments
![]()
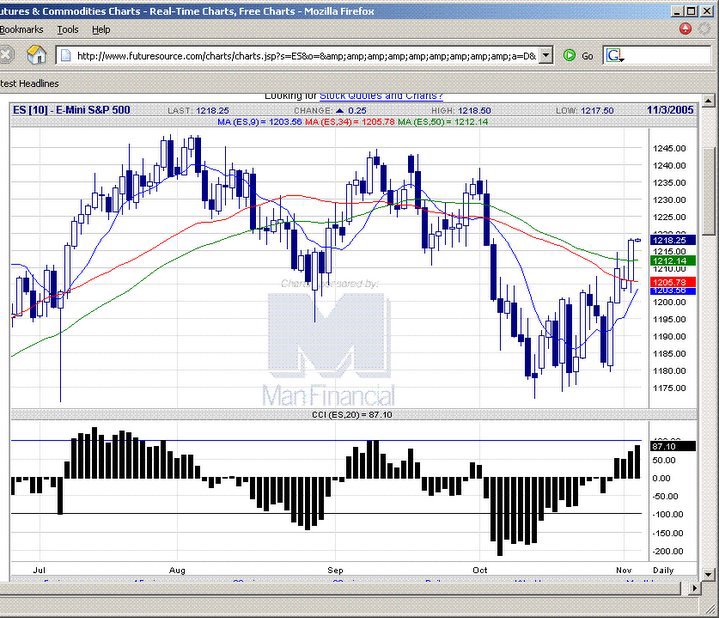
 20051103 Strategy of buying on pullback would have turned ut good in the morning. CCI momentum building to the upside, but the candlestick shows signs of profit taking.
E-mini S&P 500 chart
20051103 Strategy of buying on pullback would have turned ut good in the morning. CCI momentum building to the upside, but the candlestick shows signs of profit taking.
E-mini S&P 500 chart
posted by emacro @ 4:46 PM
0 comments
![]()
 20051002 ES broke the high of the ID candlestick and settles strongly up. Would look for pullbacks to the movig average levels to enter the uptrend move.
E-mini S&P 500 chart
20051002 ES broke the high of the ID candlestick and settles strongly up. Would look for pullbacks to the movig average levels to enter the uptrend move.
E-mini S&P 500 chart
posted by emacro @ 4:06 PM
0 comments
![]()
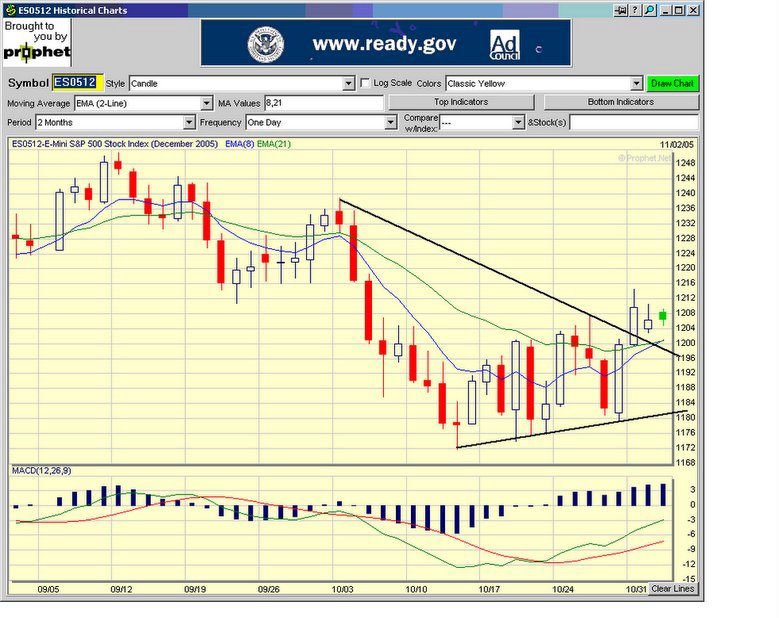 20051002 4:20 am ET. If the breakout does come to the downside, could represent a retrcement downwards to the support level 1201 for an opportunity to enter long. ES 1200 Nov call options or even Dec could be the vehicle.
E-mini S&P 500 chart
20051002 4:20 am ET. If the breakout does come to the downside, could represent a retrcement downwards to the support level 1201 for an opportunity to enter long. ES 1200 Nov call options or even Dec could be the vehicle.
E-mini S&P 500 chart
posted by emacro @ 12:47 AM
0 comments
![]()
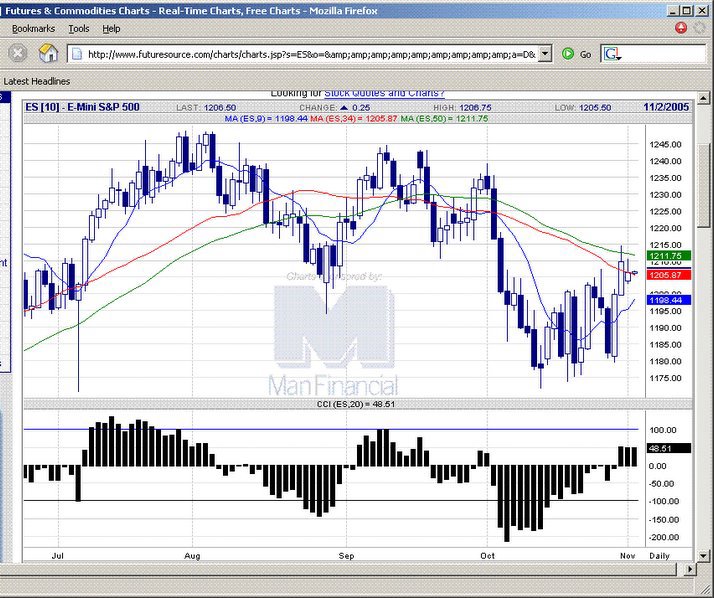 20051101 FOMC meeting day serves up an ID candlestick pattern, pinting to possible breakout either side.
E-mini S&P 500 chart
20051101 FOMC meeting day serves up an ID candlestick pattern, pinting to possible breakout either side.
E-mini S&P 500 chart
posted by emacro @ 8:20 PM
0 comments
![]()