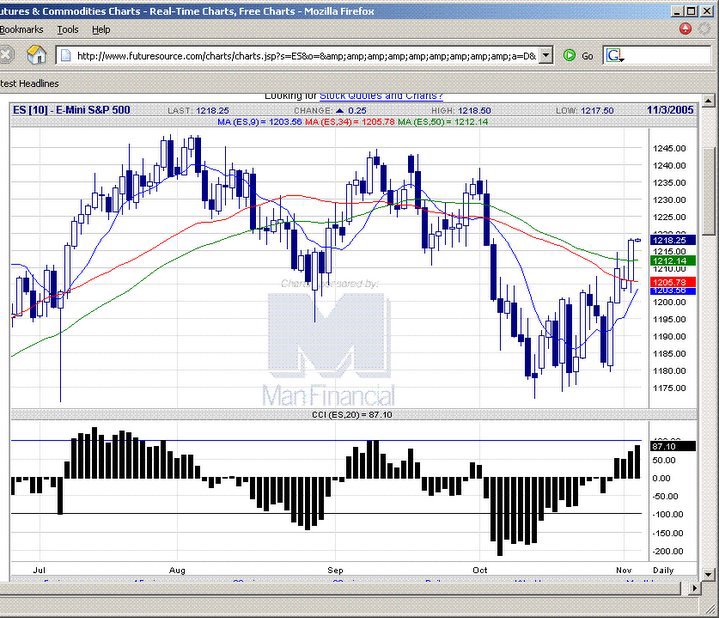
 20051002 ES broke the high of the ID candlestick and settles strongly up. Would look for pullbacks to the movig average levels to enter the uptrend move.
  E-mini S&P 500 chart
posted by emacro @ 4:06 PM
0 comments
![]()
Chronicle of trading in ES S&P 500 index futures using momentum indicator CCI. Charts by www.futuresource.com. Note: The content here are for educational purposes only. Nothing in this blog constitute advice to buy or sell financial instruments and should not be construed as 'investment advice'.
20051002 ES broke the high of the ID candlestick and settles strongly up. Would look for pullbacks to the movig average levels to enter the uptrend move.
E-mini S&P 500 chart
posted by emacro @ 4:06 PM
0 comments
![]()


0 Comments:
Post a Comment
<< Home