
posted by emacro @ 5:53 PM
0 comments
![]()
S&P 500 Charts
Chronicle of trading in ES S&P 500 index futures using momentum indicator CCI. Charts by www.futuresource.com. Note: The content here are for educational purposes only. Nothing in this blog constitute advice to buy or sell financial instruments and should not be construed as 'investment advice'.
Friday, September 30, 2005
Thursday, September 29, 2005

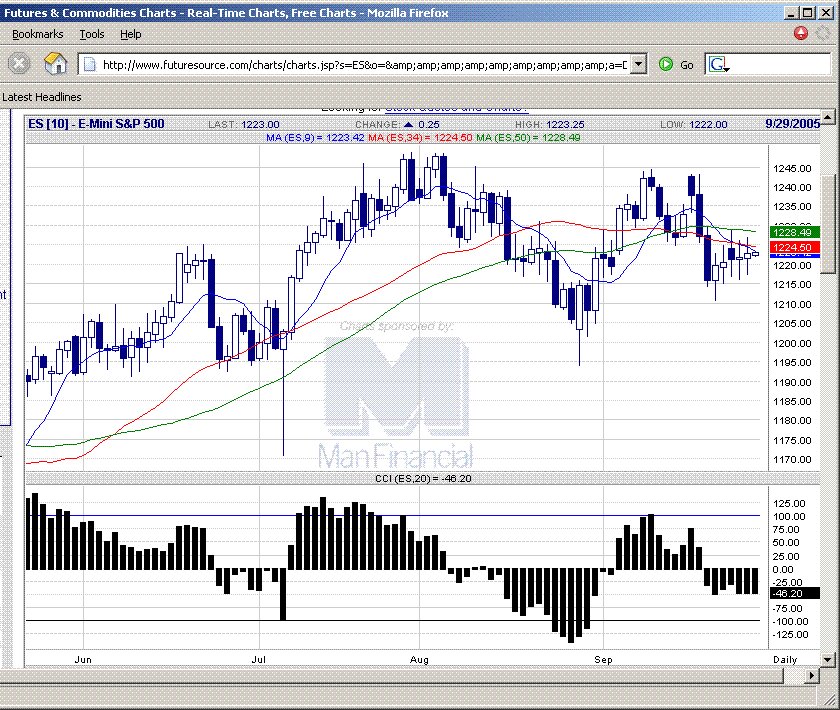
20050929 Bears unable to hold the prices down, candle shows buying pushing up to close near highs. This move out of the consolidation (coiled spring) could be the prelude to a continuation of upside move.
 E-mini S&P 500 chart
posted by emacro @ 6:31 PM
0 comments
![]()
Wednesday, September 28, 2005
posted by emacro @ 7:48 PM
0 comments
![]()
Tuesday, September 27, 2005
20050927 Big doji candlestick. CCI momentum on downside, watching which way CCI breaks, but balance is on the downside.
E-mini S&P 500 chart
posted by emacro @ 7:02 PM
0 comments
![]()
Monday, September 26, 2005

posted by emacro @ 5:05 PM
0 comments
![]()
Saturday, September 24, 2005
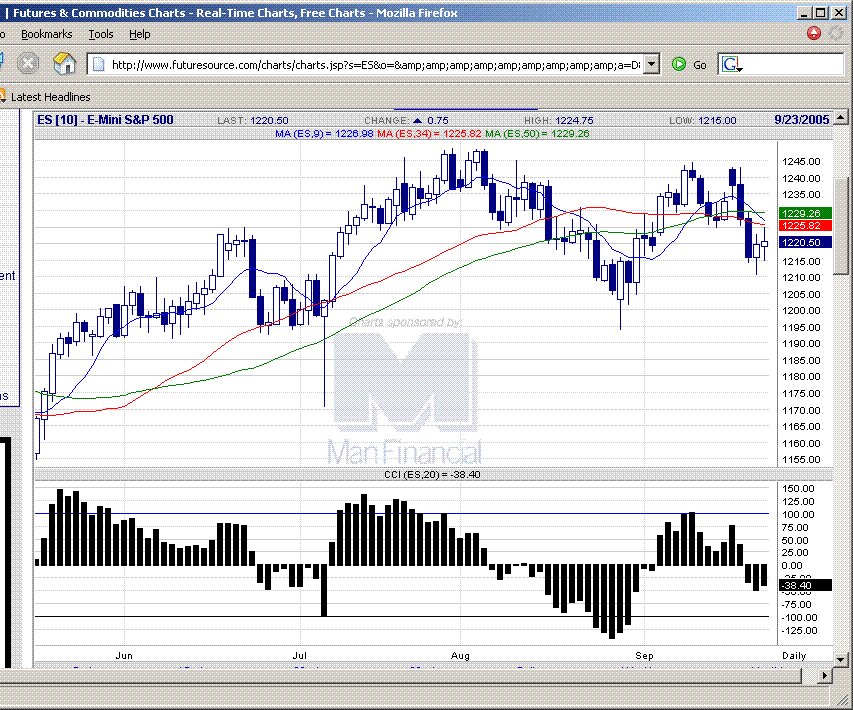
20050923 1225.8 is a good level to short against, (moving average) for swing trade short.
E-mini S&P 500 chart
posted by emacro @ 12:42 AM
1 comments
![]()
Thursday, September 22, 2005

20050922 A rebound after 3 days down. 1224-1225 around the level of the 9 moving average would be a level to look for short to continue the downtrend alluded to yesterday.
E-mini S&P 500 chart
posted by emacro @ 6:34 PM
0 comments
![]()
Wednesday, September 21, 2005

20050921 A econd consecutive big selling candlestick. Now way below moving avgs, so could be start of a period of downtrend. CCI momentum accelerates to the downside supporting down bias.
E-mini S&P 500 chart
posted by emacro @ 5:59 PM
1 comments
![]()
Tuesday, September 20, 2005

Friday, September 16, 2005

20050916 Bounces off the moving average support, showing a ZLR buy signal today.
E-mini S&P 500 chart
posted by emacro @ 6:09 PM
0 comments
![]()
Thursday, September 15, 2005

20050915 A balanced day between buyers and selllers, ahead of options expiration on Friday.
E-mini S&P 500 chart
posted by emacro @ 4:54 PM
0 comments
![]()
Wednesday, September 14, 2005

20050914 ES testing the moving averages, crucial for the market to hold these levels.
E-mini S&P 500 chart
posted by emacro @ 5:23 PM
0 comments
![]()
Tuesday, September 13, 2005

20050913 Break in the ES to test the moving average. Have to see if can move up from here.
E-mini S&P 500 chart
posted by emacro @ 7:09 PM
0 comments
![]()
Monday, September 12, 2005

posted by emacro @ 4:50 PM
0 comments
![]()
Friday, September 09, 2005

20050909 Big candle indicates buying interest, bring S&P 500 near the previous highs. Expect more strength on the opening on Monday, barring unforseen news events.
E-mini S&P 500 chart
posted by emacro @ 6:31 PM
0 comments
![]()
Thursday, September 08, 2005

Wednesday, September 07, 2005

20050907 A consolidation candlestick after the big rally. CCI momentum turning positive.
E-mini S&P 500 chart
posted by emacro @ 4:56 PM
0 comments
![]()
Tuesday, September 06, 2005

20050906 Simultaneous breakout of the ID (inside day) candlestick and CCI punching above the zero line. Should be more strength tomorow, at least in the morning.
E-mini S&P 500 chart
posted by emacro @ 5:17 PM
0 comments
![]()
Friday, September 02, 2005


20050902 In between the moving averages, and formed an ID (Inside Day). CCI momentum on the downside.
E-mini S&P 500 chart
posted by emacro @ 7:39 PM
0 comments
![]()
Thursday, September 01, 2005

20050901 Some initial follow thrugh early morning, which is expected after a big candlestick. Doji by the end of the day, with CCI trying the major resistance zero line. If CCI goes through zero could signal more upside ahead.
E-mini S&P 500 chart
posted by emacro @ 6:26 PM
1 comments
![]()
Sponsors
- 20110525 ES futures 2 min Wolfe wave reaches the o...
- 2011054 A wolfe wave long on ES futures after the ...
- 20110517 A amall 5 min EUR futures wolfe wave, a s...
- 20110517 ES futures, wofe wave long i globex.
- 20110516 Halfway move on Soybean futures, and a de...
- 20110516 ES
- 20110516 ES futures 5 min, woldfe wave in globex s...
- 20110513 ES futures sell on wolfe wave 5 min.
- 5 min ES
- 20110512 July Soybean sutures....5 min.
- June 2005
- July 2005
- August 2005
- September 2005
- October 2005
- November 2005
- December 2005
- January 2006
- February 2006
- March 2006
- April 2006
- May 2006
- June 2006
- July 2006
- August 2006
- September 2006
- October 2006
- November 2006
- December 2006
- January 2007
- February 2007
- March 2007
- April 2007
- May 2007
- June 2007
- July 2007
- August 2007
- September 2007
- October 2007
- November 2007
- June 2008
- August 2008
- September 2008
- October 2008
- November 2008
- December 2008
- March 2009
- March 2010
- May 2010
- July 2010
- August 2010
- September 2010
- October 2010
- March 2011
- April 2011
- May 2011
- Current Posts
Links
Previous Posts
Archives

Syndicate this site


