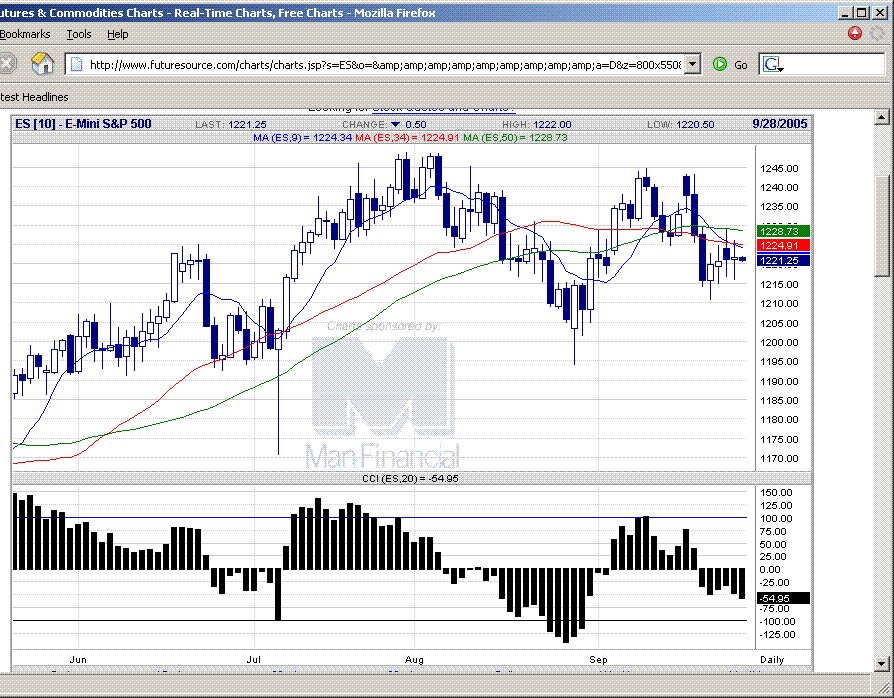
20050927 Big doji candlestick. CCI momentum on downside, watching which way CCI breaks, but balance is on the downside.
 E-mini S&P 500 chart
posted by emacro @ 7:02 PM
0 comments
![]()
Chronicle of trading in ES S&P 500 index futures using momentum indicator CCI. Charts by www.futuresource.com. Note: The content here are for educational purposes only. Nothing in this blog constitute advice to buy or sell financial instruments and should not be construed as 'investment advice'.
E-mini S&P 500 chart
posted by emacro @ 7:02 PM
0 comments
![]()


0 Comments:
Post a Comment
<< Home