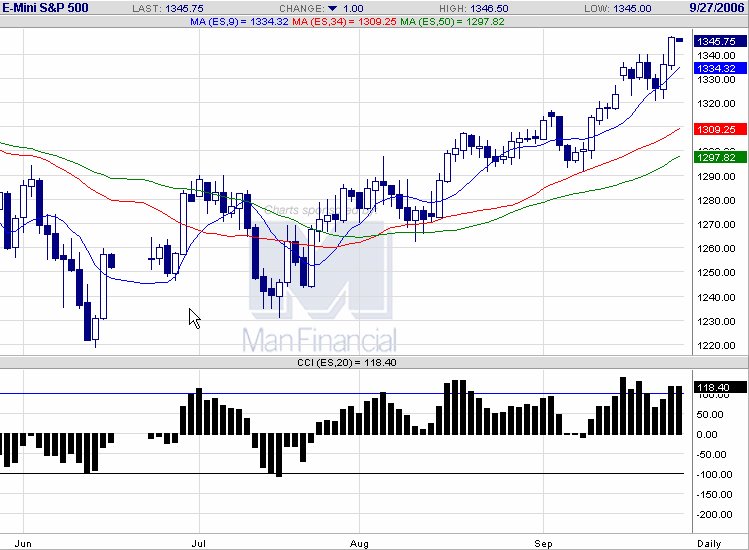
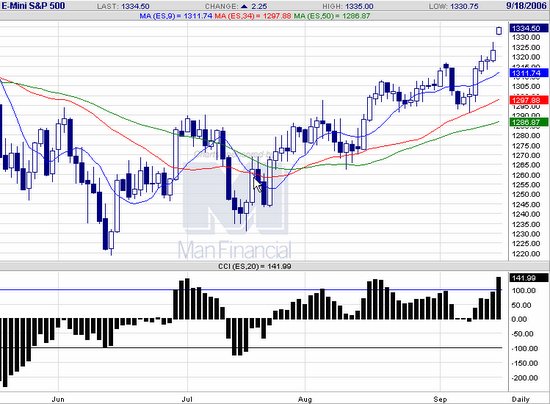
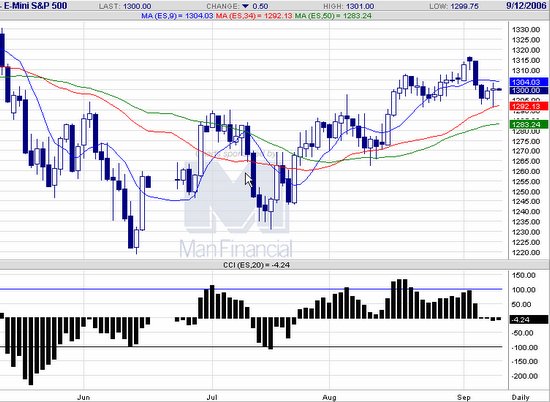
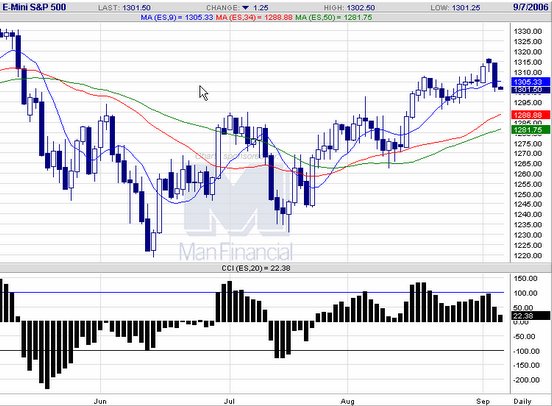
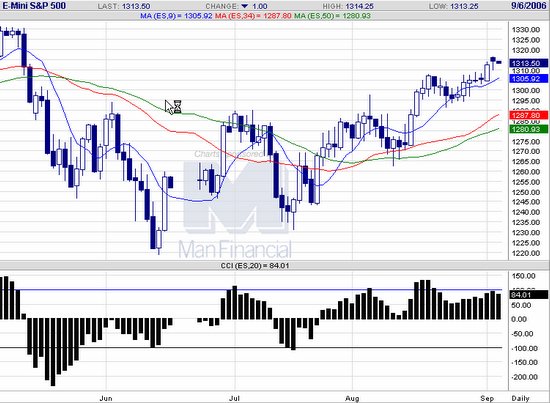
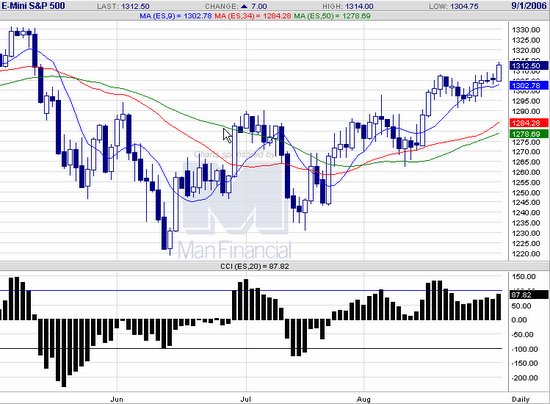
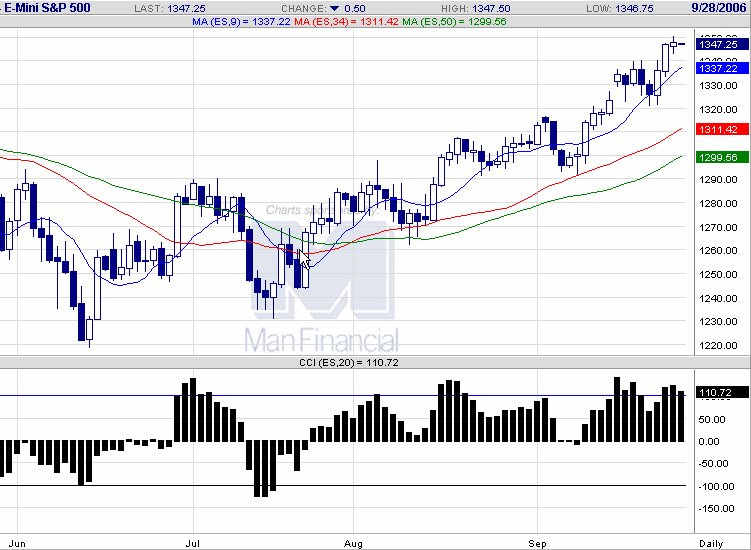
 20060927 With the dow within points of the all time high, ES shows hesitation with small range and body of the candlestick. If spurts up, may provide a short term short trade.
  E-mini S&P 500 chart
posted by emacro @ 5:29 PM
0 comments
![]()