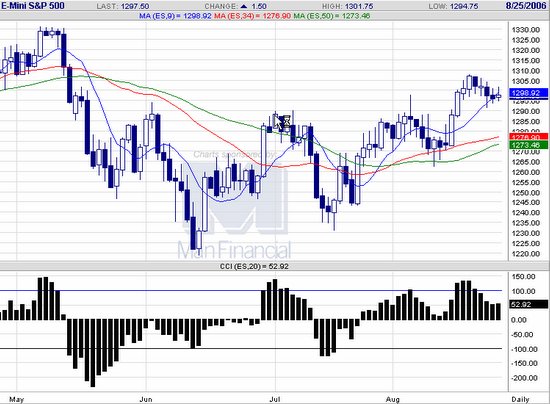
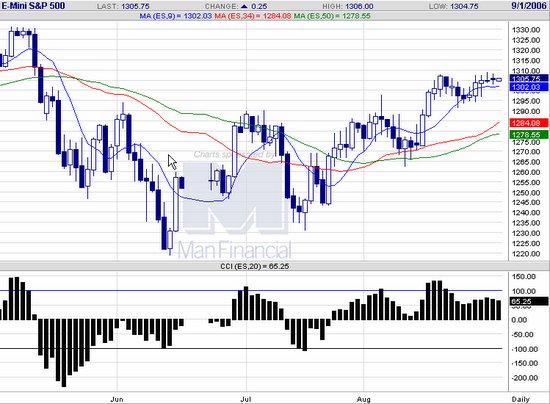
 20060831 Employment number tomorrow, will dictate the impending break either side for the ES.
  E-mini S&P 500 chart
posted by emacro @ 5:36 PM
0 comments
![]()
Chronicle of trading in ES S&P 500 index futures using momentum indicator CCI. Charts by www.futuresource.com. Note: The content here are for educational purposes only. Nothing in this blog constitute advice to buy or sell financial instruments and should not be construed as 'investment advice'.
20060831 Employment number tomorrow, will dictate the impending break either side for the ES.
E-mini S&P 500 chart
posted by emacro @ 5:36 PM
0 comments
![]()
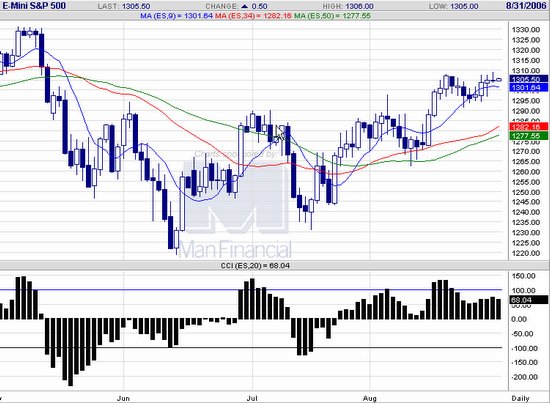 20060830 ES broke out of the consolidation pattern we have been watching. This is a bull flag pattern. While ES is encountering some resistance, break out above the candlestick wicks of past few days will propel to new highs.
E-mini S&P 500 chart
20060830 ES broke out of the consolidation pattern we have been watching. This is a bull flag pattern. While ES is encountering some resistance, break out above the candlestick wicks of past few days will propel to new highs.
E-mini S&P 500 chart
posted by emacro @ 9:08 PM
0 comments
![]()
posted by emacro @ 6:53 PM
0 comments
![]()
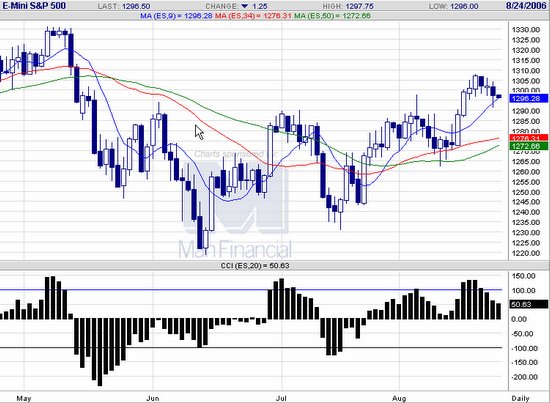
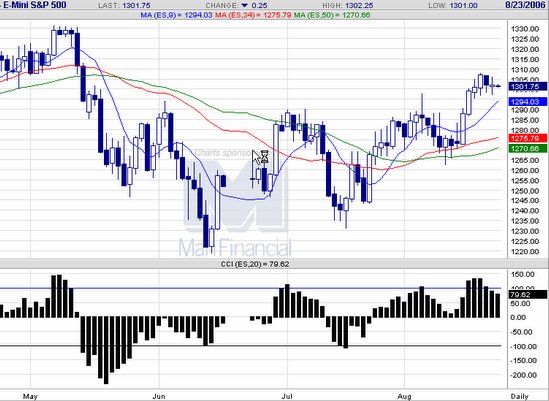
 20060824 ES shows inside day pattern. Looking for breakout either side, bias on upside, due to bull flag pattern.
E-mini S&P 500 chart
20060824 ES shows inside day pattern. Looking for breakout either side, bias on upside, due to bull flag pattern.
E-mini S&P 500 chart
posted by emacro @ 5:09 PM
0 comments
![]()
posted by emacro @ 5:23 PM
0 comments
![]()
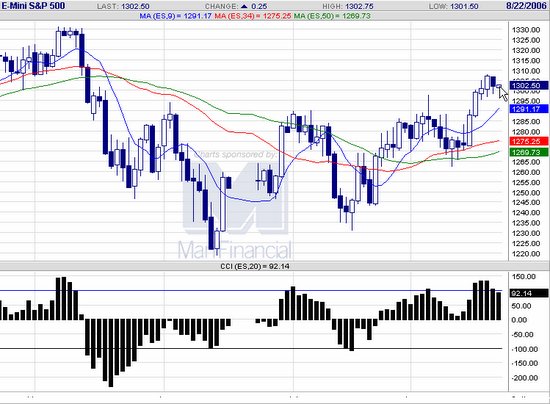
 20060822 ES a spinning top candlestick pattern, indicates indecision. Could be setting up a breakout trend day tomorrow.
E-mini S&P 500 chart
20060822 ES a spinning top candlestick pattern, indicates indecision. Could be setting up a breakout trend day tomorrow.
E-mini S&P 500 chart
posted by emacro @ 7:00 PM
0 comments
![]()
posted by emacro @ 6:48 PM
0 comments
![]()
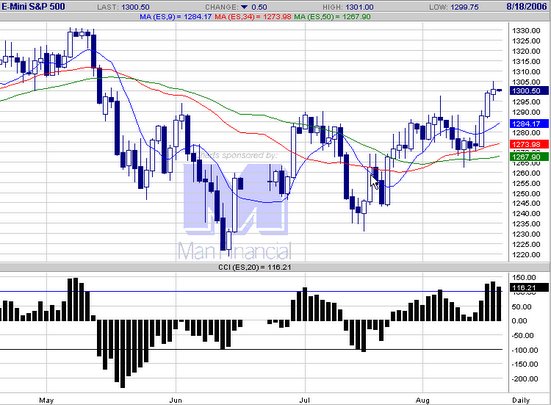
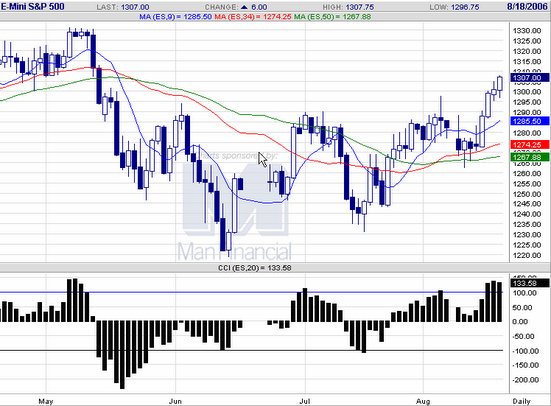 20060818 CCI moves into overbought, but strong close into end of the week, create conditions for the uptrend to continue.
E-mini S&P 500 chart
20060818 CCI moves into overbought, but strong close into end of the week, create conditions for the uptrend to continue.
E-mini S&P 500 chart
posted by emacro @ 6:44 PM
0 comments
![]()
posted by emacro @ 7:43 PM
0 comments
![]()
posted by emacro @ 7:43 PM
0 comments
![]()
posted by emacro @ 8:06 PM
0 comments
![]()
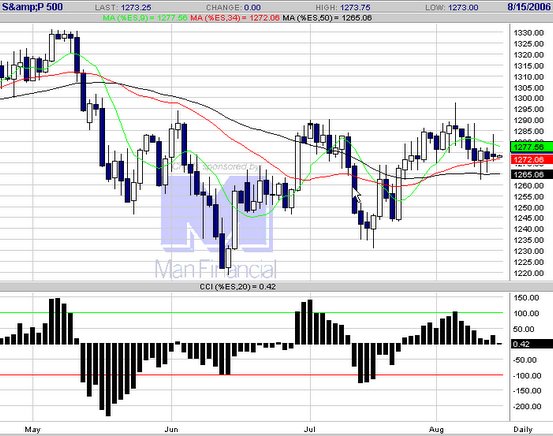 20060814 ES initial strength due to UN Mid East ceasefire plan, was unable to hold gains and becomes a 'shooting star' candlestick pattern.
E-mini S&P 500 chart
20060814 ES initial strength due to UN Mid East ceasefire plan, was unable to hold gains and becomes a 'shooting star' candlestick pattern.
E-mini S&P 500 chart
posted by emacro @ 7:38 PM
0 comments
![]()
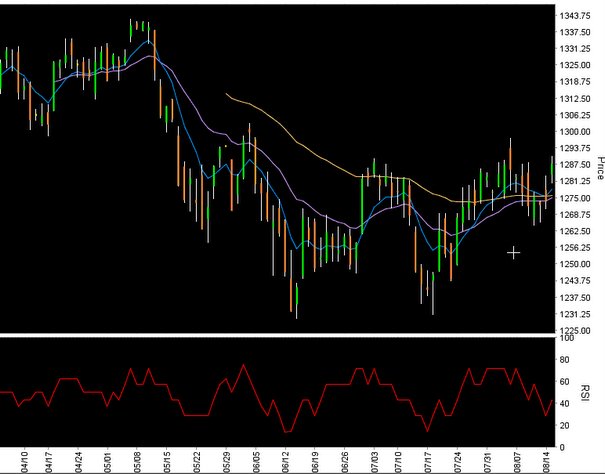
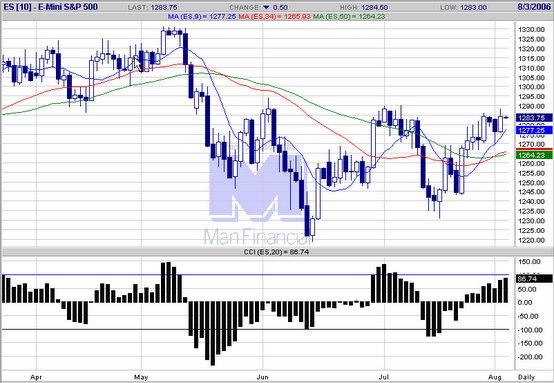
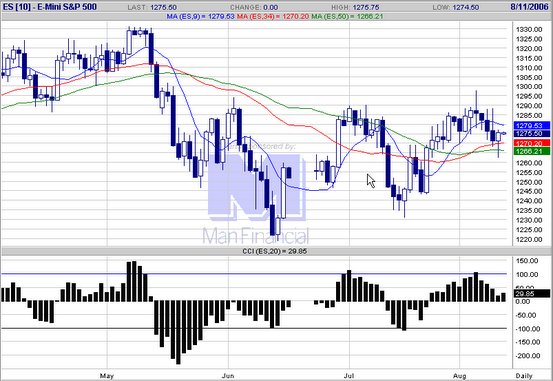
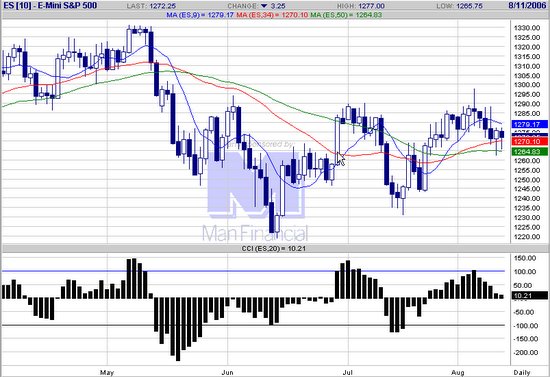 20060811 ES closes weaker into weekend. Needs to stay above 1264 to ward off bearish sentiment.
E-mini S&P 500 chart
20060811 ES closes weaker into weekend. Needs to stay above 1264 to ward off bearish sentiment.
E-mini S&P 500 chart
posted by emacro @ 1:07 AM
0 comments
![]()
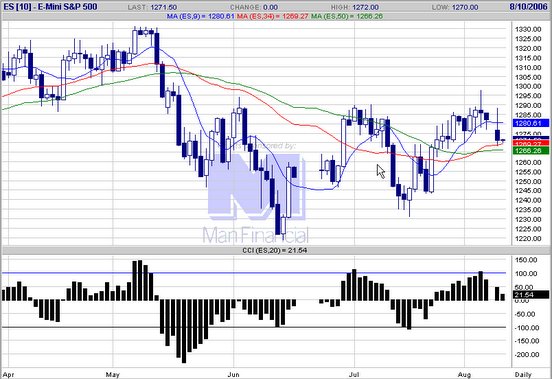
 20060810 ES stable, on the day of the foiling of Terror plot in London to blow up airliners with liquid explosives.
E-mini S&P 500 chart
20060810 ES stable, on the day of the foiling of Terror plot in London to blow up airliners with liquid explosives.
E-mini S&P 500 chart
posted by emacro @ 6:27 PM
0 comments
![]()
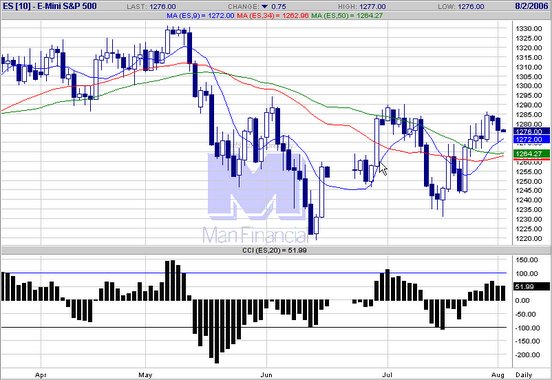
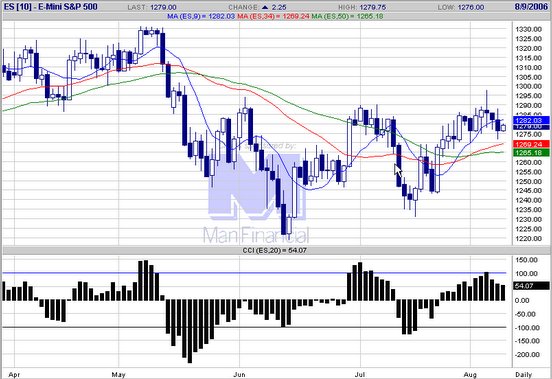
 20060809 ES could not hold gains, brekas into support. 1285 is the key to bulls, which fails to hold.
E-mini S&P 500 chart
20060809 ES could not hold gains, brekas into support. 1285 is the key to bulls, which fails to hold.
E-mini S&P 500 chart
posted by emacro @ 6:08 PM
0 comments
![]()
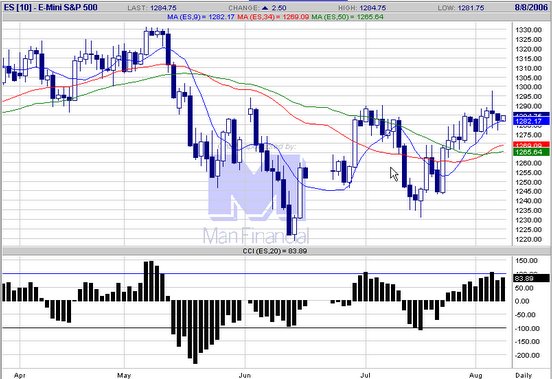
 20060808 ES fails to sustain gains on the FOMC announcement of holding interest rates unchanged. Weak closing below key 1285 level, bearish indications.
E-mini S&P 500 chart
20060808 ES fails to sustain gains on the FOMC announcement of holding interest rates unchanged. Weak closing below key 1285 level, bearish indications.
E-mini S&P 500 chart
posted by emacro @ 7:35 PM
0 comments
![]()
posted by emacro @ 7:47 PM
0 comments
![]()
posted by emacro @ 8:44 PM
0 comments
![]()
posted by emacro @ 6:14 PM
0 comments
![]()
posted by emacro @ 6:17 PM
0 comments
![]()