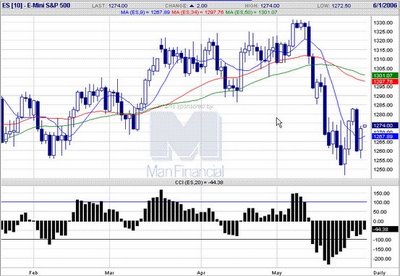
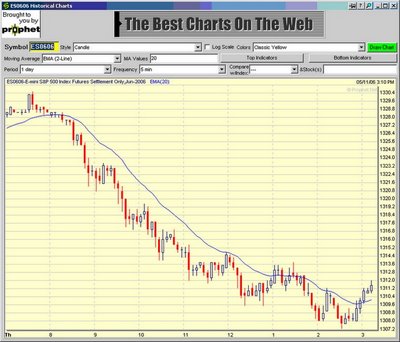
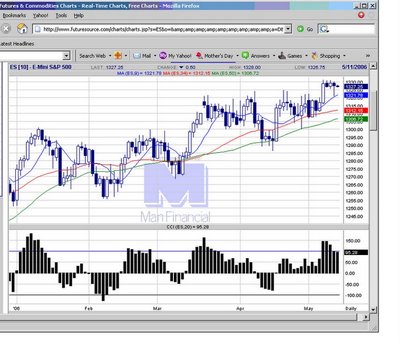
S&P 500 Charts
Chronicle of trading in ES S&P 500 index futures using momentum indicator CCI. Charts by www.futuresource.com. Note: The content here are for educational purposes only. Nothing in this blog constitute advice to buy or sell financial instruments and should not be construed as 'investment advice'.
Wednesday, May 31, 2006
Tuesday, May 30, 2006
 20060530 Engulfing bearish on the ES coupled with ZLR sell signal, makes this one particularly strong.
  E-mini S&P 500 chart
Friday, May 26, 2006
 20060526 ES support is 1270. Gains continue, as we expected, ahead of the Memorial Day long weekend.
  E-mini S&P 500 chart
 20060526 11:33 am EST. YM 11200 calls now in healthy position, as the market has rebounded as we expected this week.
  E-mini S&P 500 chart
Thursday, May 25, 2006
 20060525 The reversal we looked for finally came. The June 11200 calls on the YM looks healthier now.
  E-mini S&P 500 chart
Wednesday, May 24, 2006
 20060524 Unlike the Russell, not a reversal hammer formation, but a big spinning top. Divergence with CCI may limit downside and support any reversal from this 'indecision' candlestick.
  E-mini S&P 500 chart
 20060524 10:04 am EST. Buying against the pivot turned out to be a good trading idea.
  E-mini S&P 500 chart
Tuesday, May 23, 2006
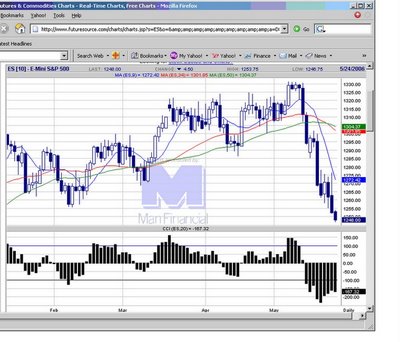 20060523 ES reached moving average intraday, but resistance and new selling drives into lower close.
  E-mini S&P 500 chart
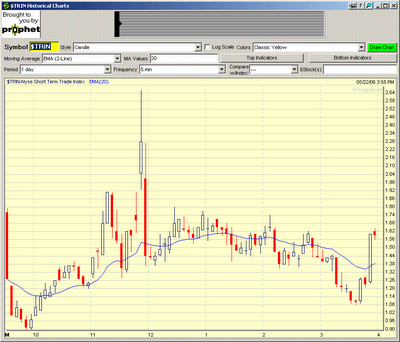
 20060522 ES chart CCI and price shows a little bit of a divergence. The TRIN intraday reached very high levels, which signals capitulation maybe.
  E-mini S&P 500 chart
Friday, May 19, 2006


20060519 Basically with the view of a market bounce, you can pick and choose whatever option instrument, as in the above ES June 1270 calls or the SPY June 127.0 calls. E-mini S&P 500 chart
 20060519 Option position went into positive temporarily. Hopefully after this retracement, continues to rally 1 or 2 days more.
  E-mini S&P 500 chart
 20060519 ES makes a spinning top candlestick formation. Indicates indecision, but hopefully the reversal on the Russell futures will drag the ES into another couple of days of rally.
  E-mini S&P 500 chart
 20060519 12:05 am EST. YM Jun 11200 calls long 2 contracts @ 143. Looking for a couple days bounce in the market after 8 consecutive down days.
  E-mini S&P 500 chart
Thursday, May 18, 2006
 20060518 ES headed for next support 1255, might be able to set up option play for longs there.
  E-mini S&P 500 chart
 20060518 6:27 am EST. Looking at the TRIN index for yesterday trading, there was a reading of above +2 into the close, closing at 1.92. Indications are for a gap open on 19 May. At the current time the ES (emini S&P500) is +6.75 on volume of 72,900 contracts, which going into US market opening should see gap up on regular session charts.
  E-mini S&P 500 chart
Wednesday, May 17, 2006


20060517 S&P 500 futures breaks through 1282 key level. CCI momentum gathering pace.
 E-mini S&P 500 chart
Tuesday, May 16, 2006
 20060516 1282 remains in focus, could be testing that soon, judging by weak price action and CCI negative momentum down.
  E-mini S&P 500 chart
Monday, May 15, 2006
 20060515 ES rebounds in late trading today. Looking for move back up to the moving average to setup short play.
  E-mini S&P 500 chart
Friday, May 12, 2006
 20060512 ES not quite the triple top formation as we see in the Russell 2000 futures. A good position trade strategy, looks to be to short a pullback to the 1306 level.
  E-mini S&P 500 chart
Thursday, May 11, 2006
 20060511 The NYSE $TRIN or Arms Index, shows a steady uptrend, which typically characterise a trend day down in play.
  E-mini S&P 500 chart
 20060511 The 1321 support broke with a trend day move.(might be due to FOMC wording) 1306 remains the focus support level. The current intraday retrace to 1311-12 may provide a good level to short, CCI momentum turns down for the first time in many weeks, supporting the short on strength play.
  E-mini S&P 500 chart
